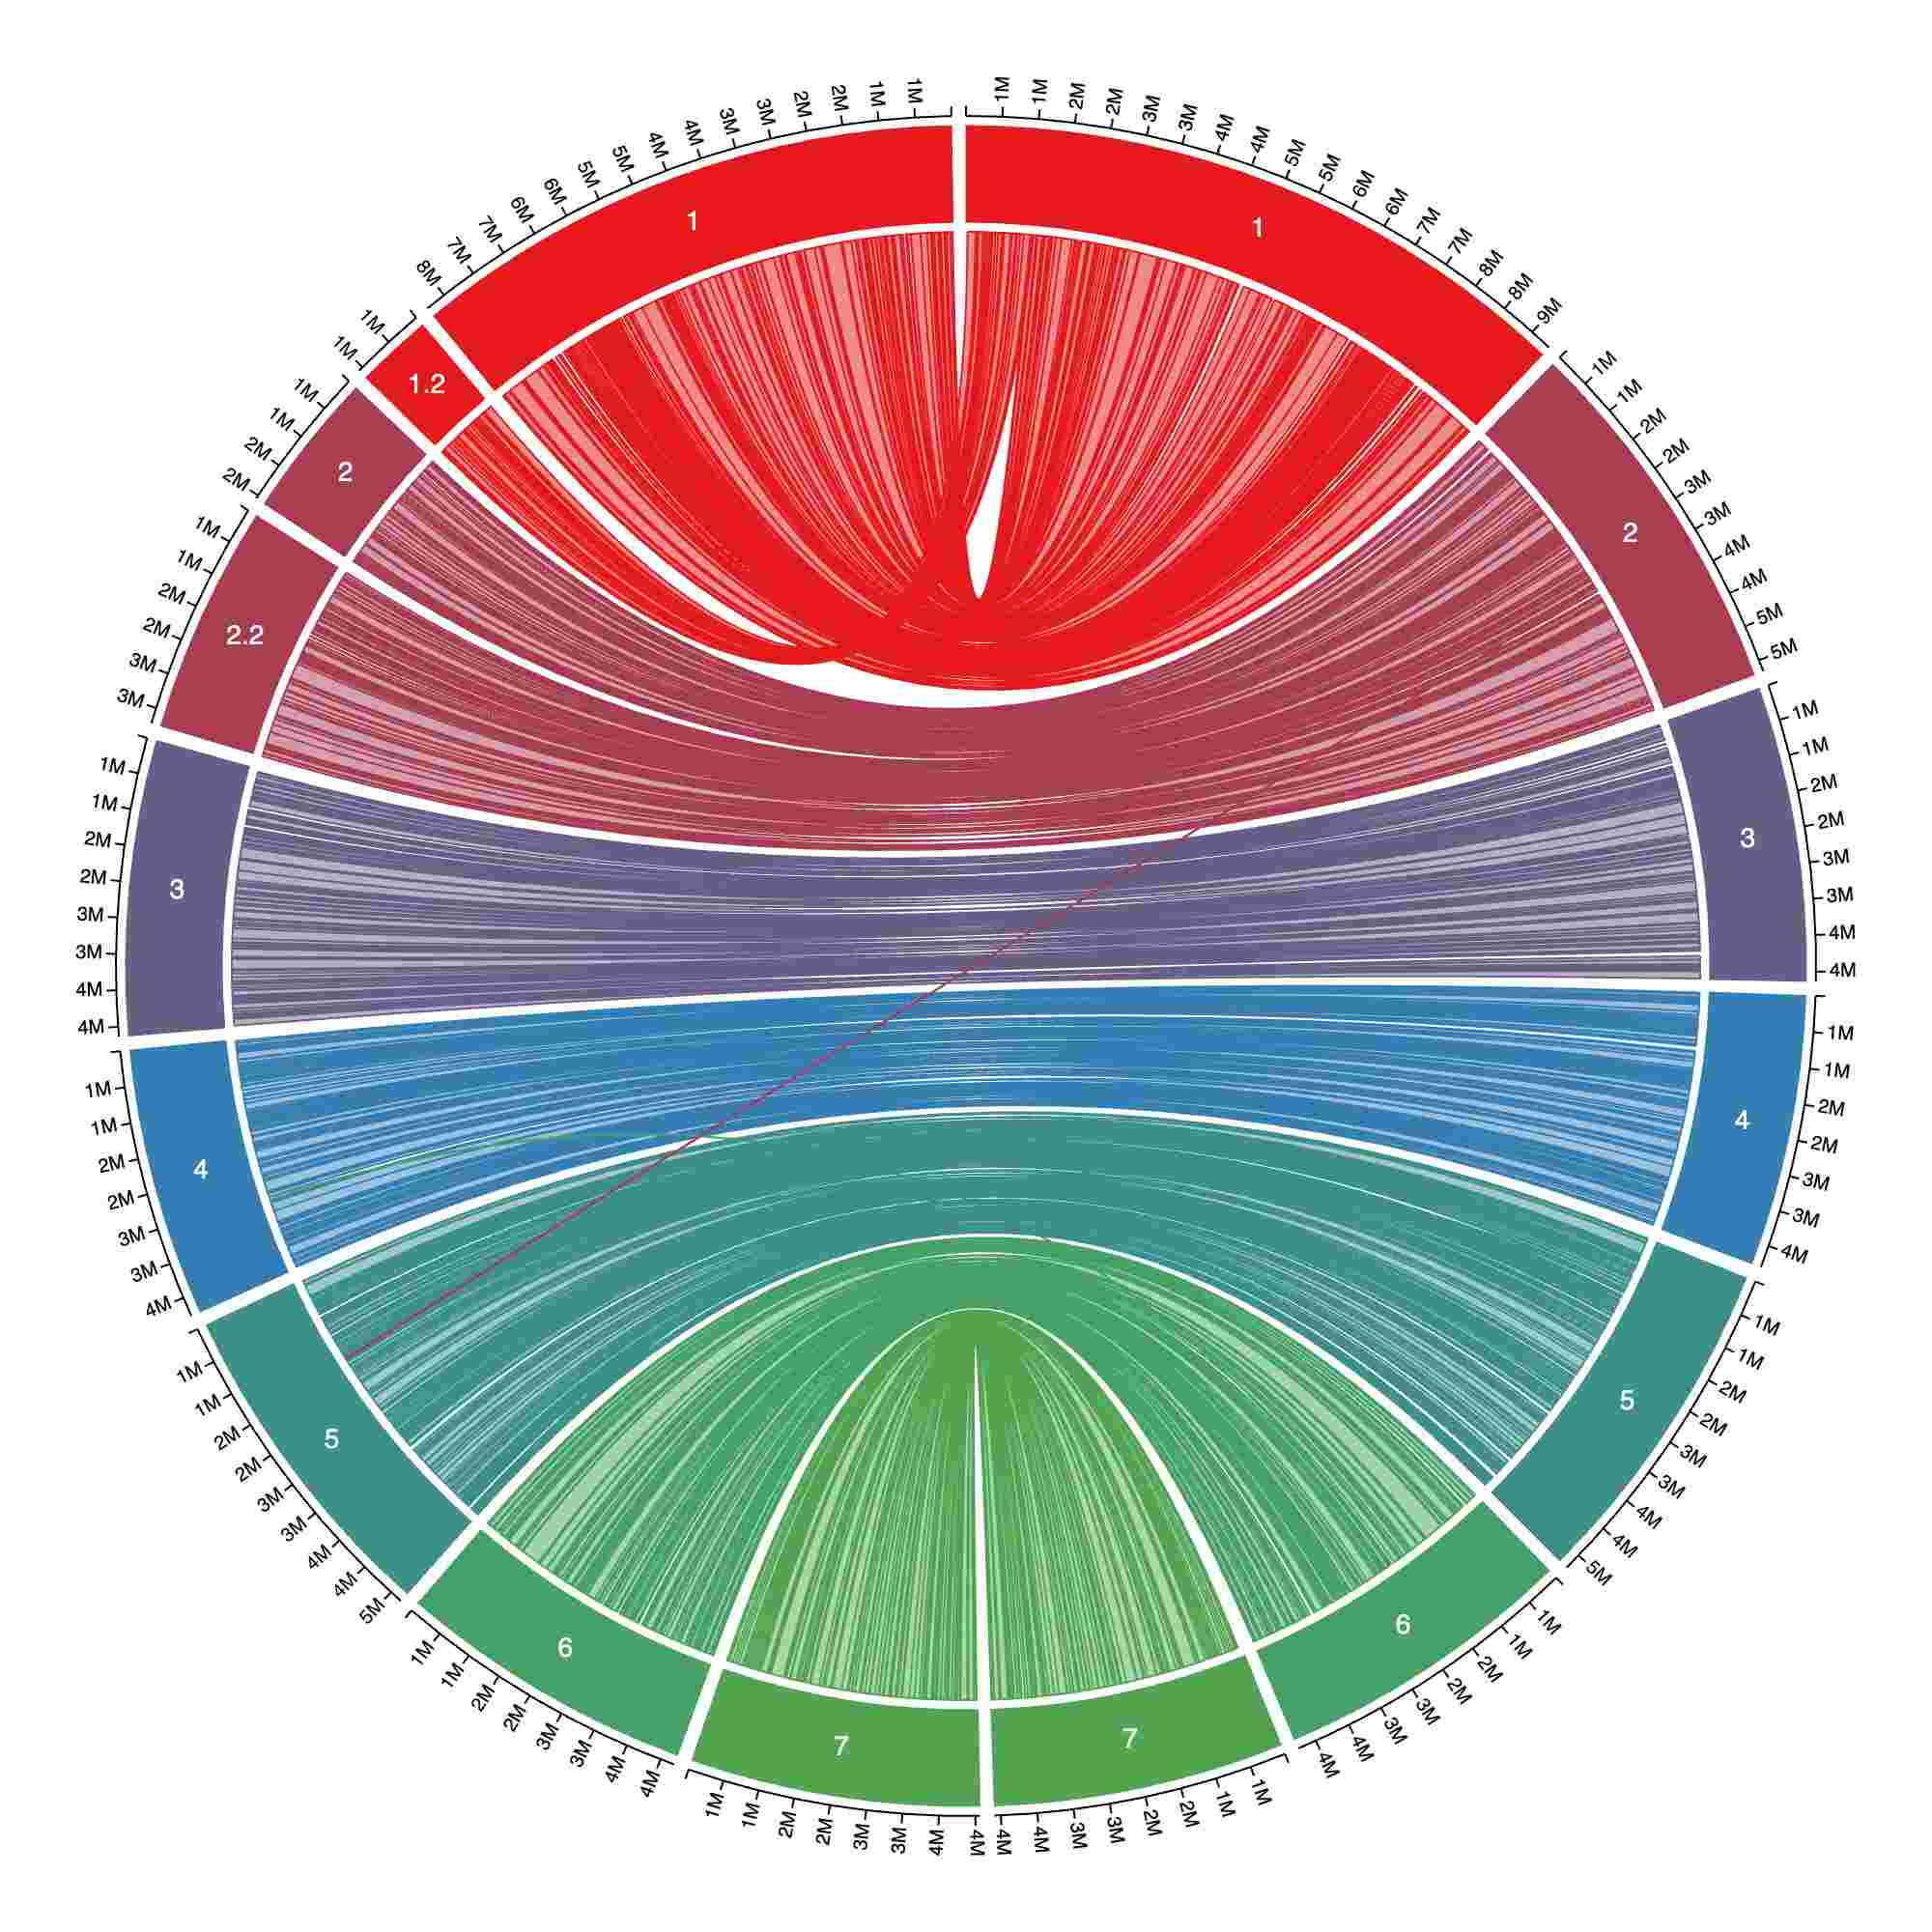
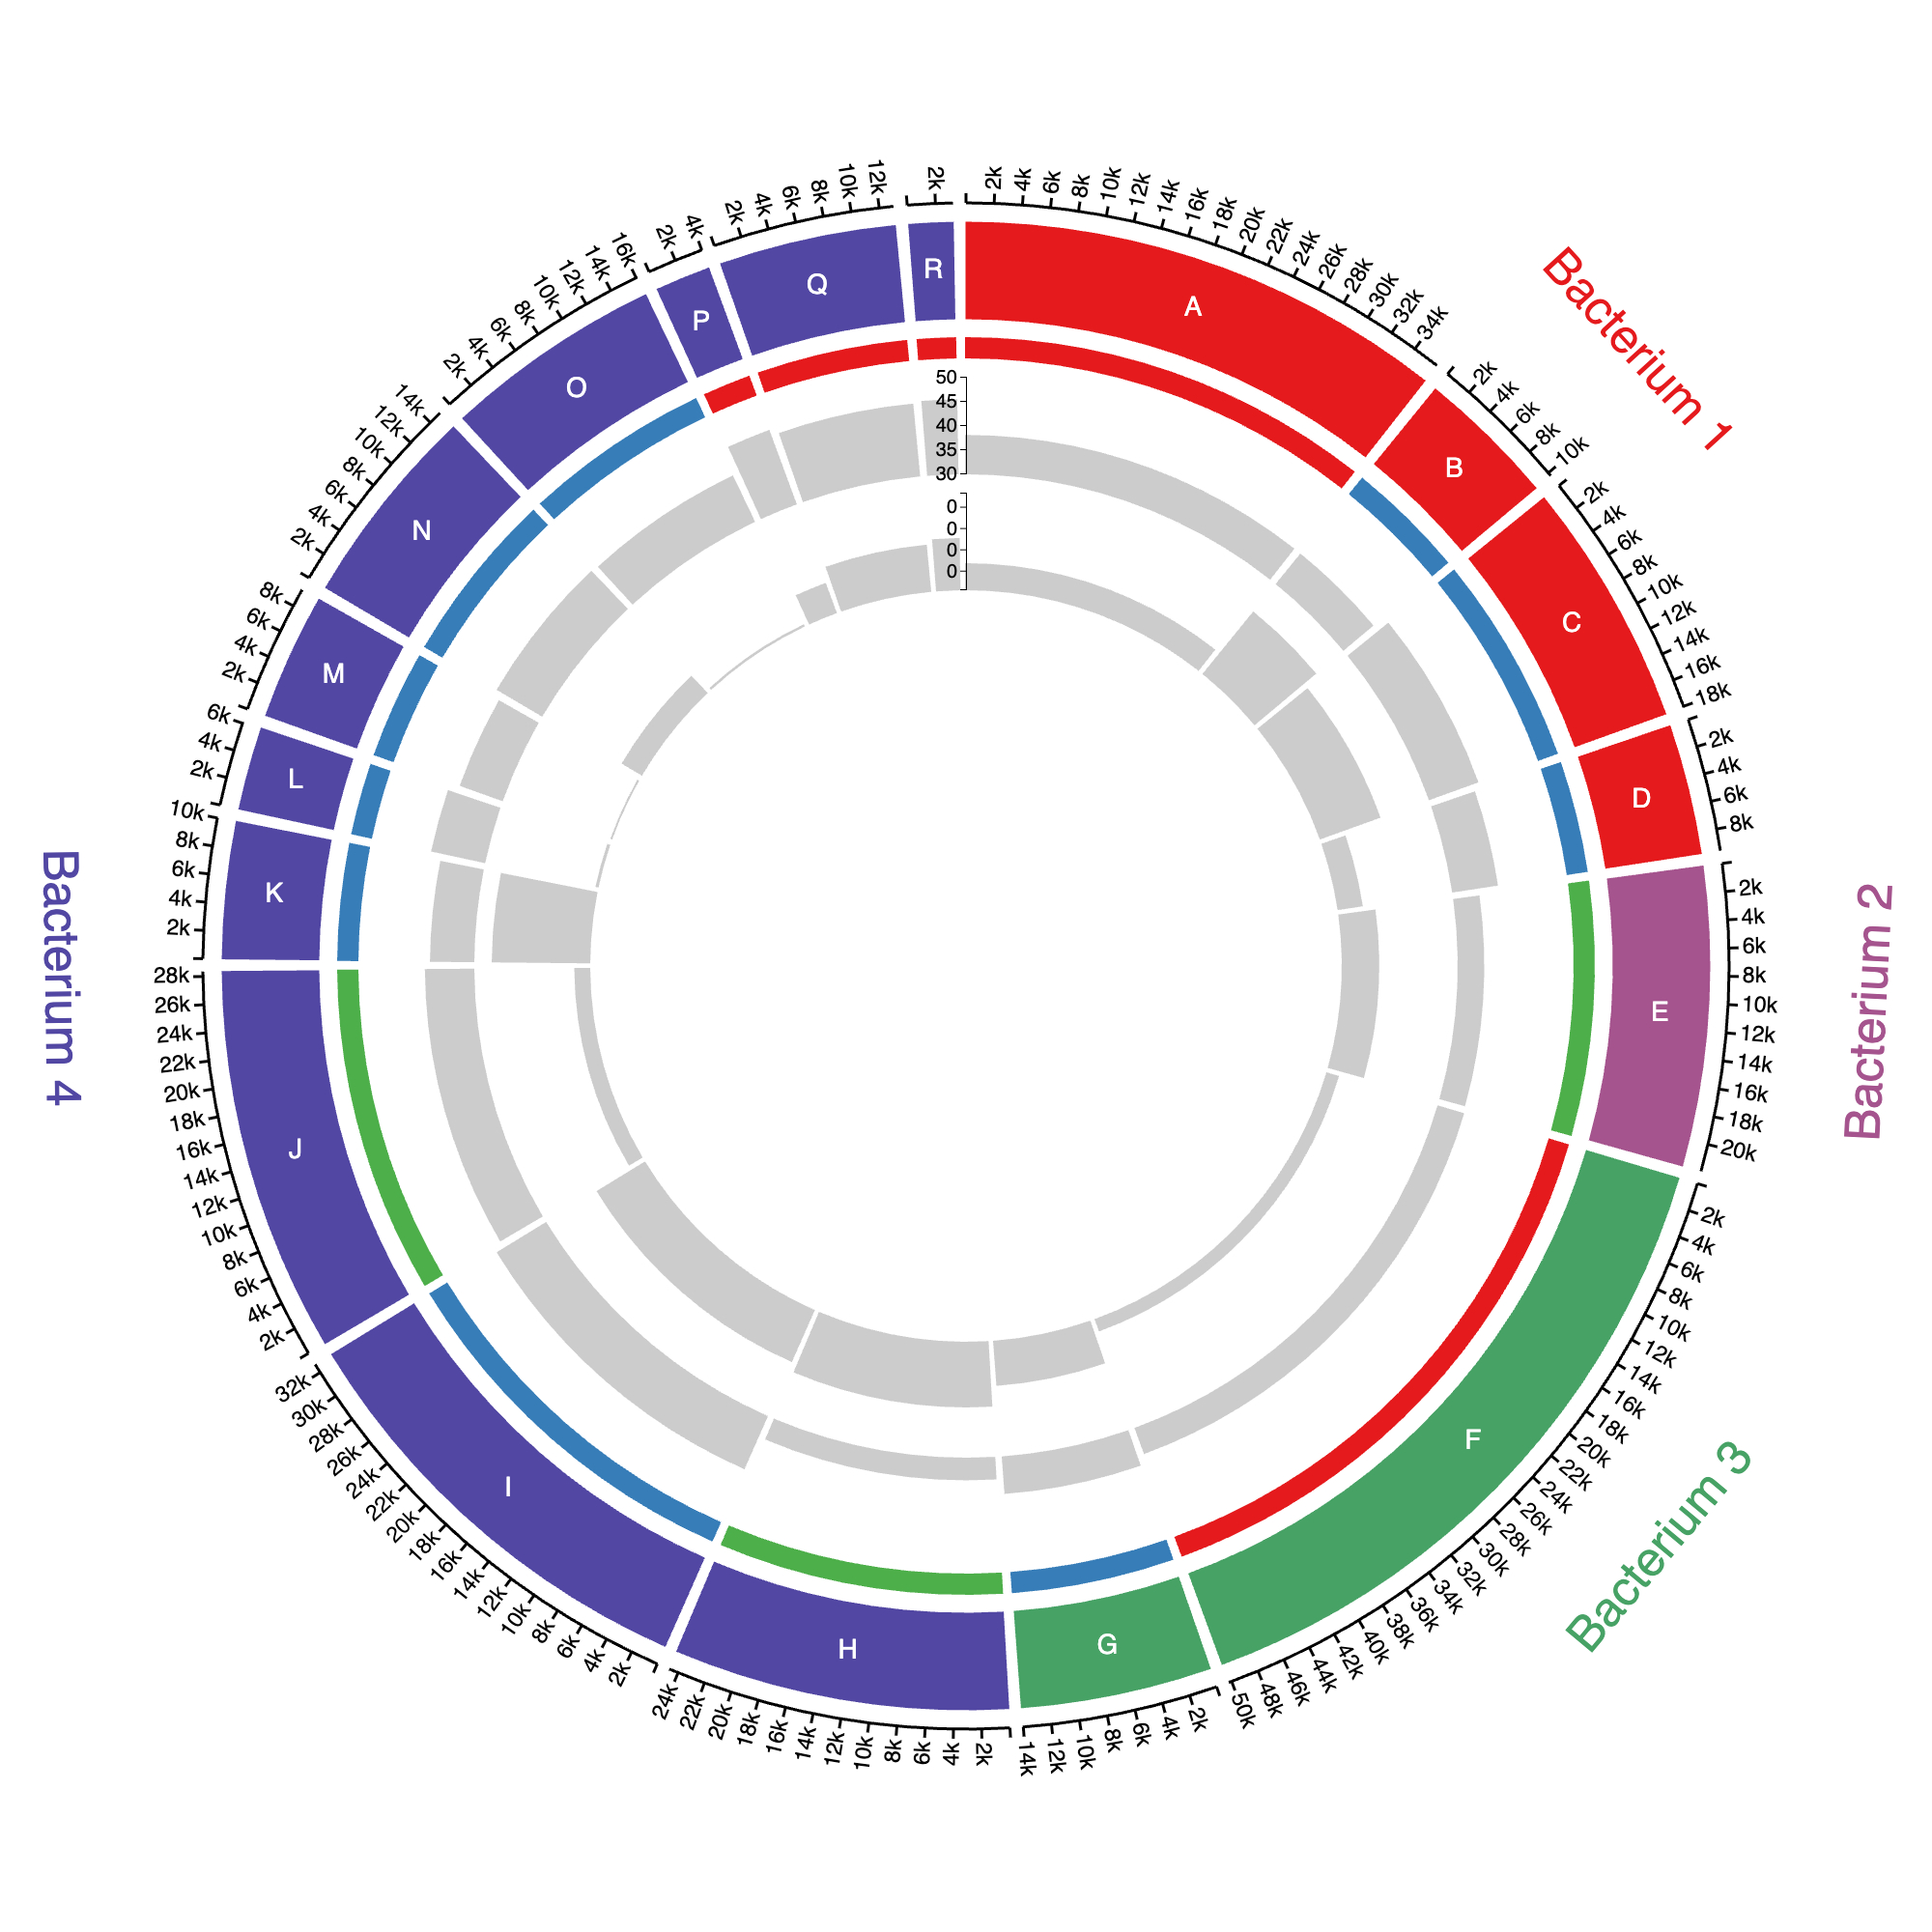
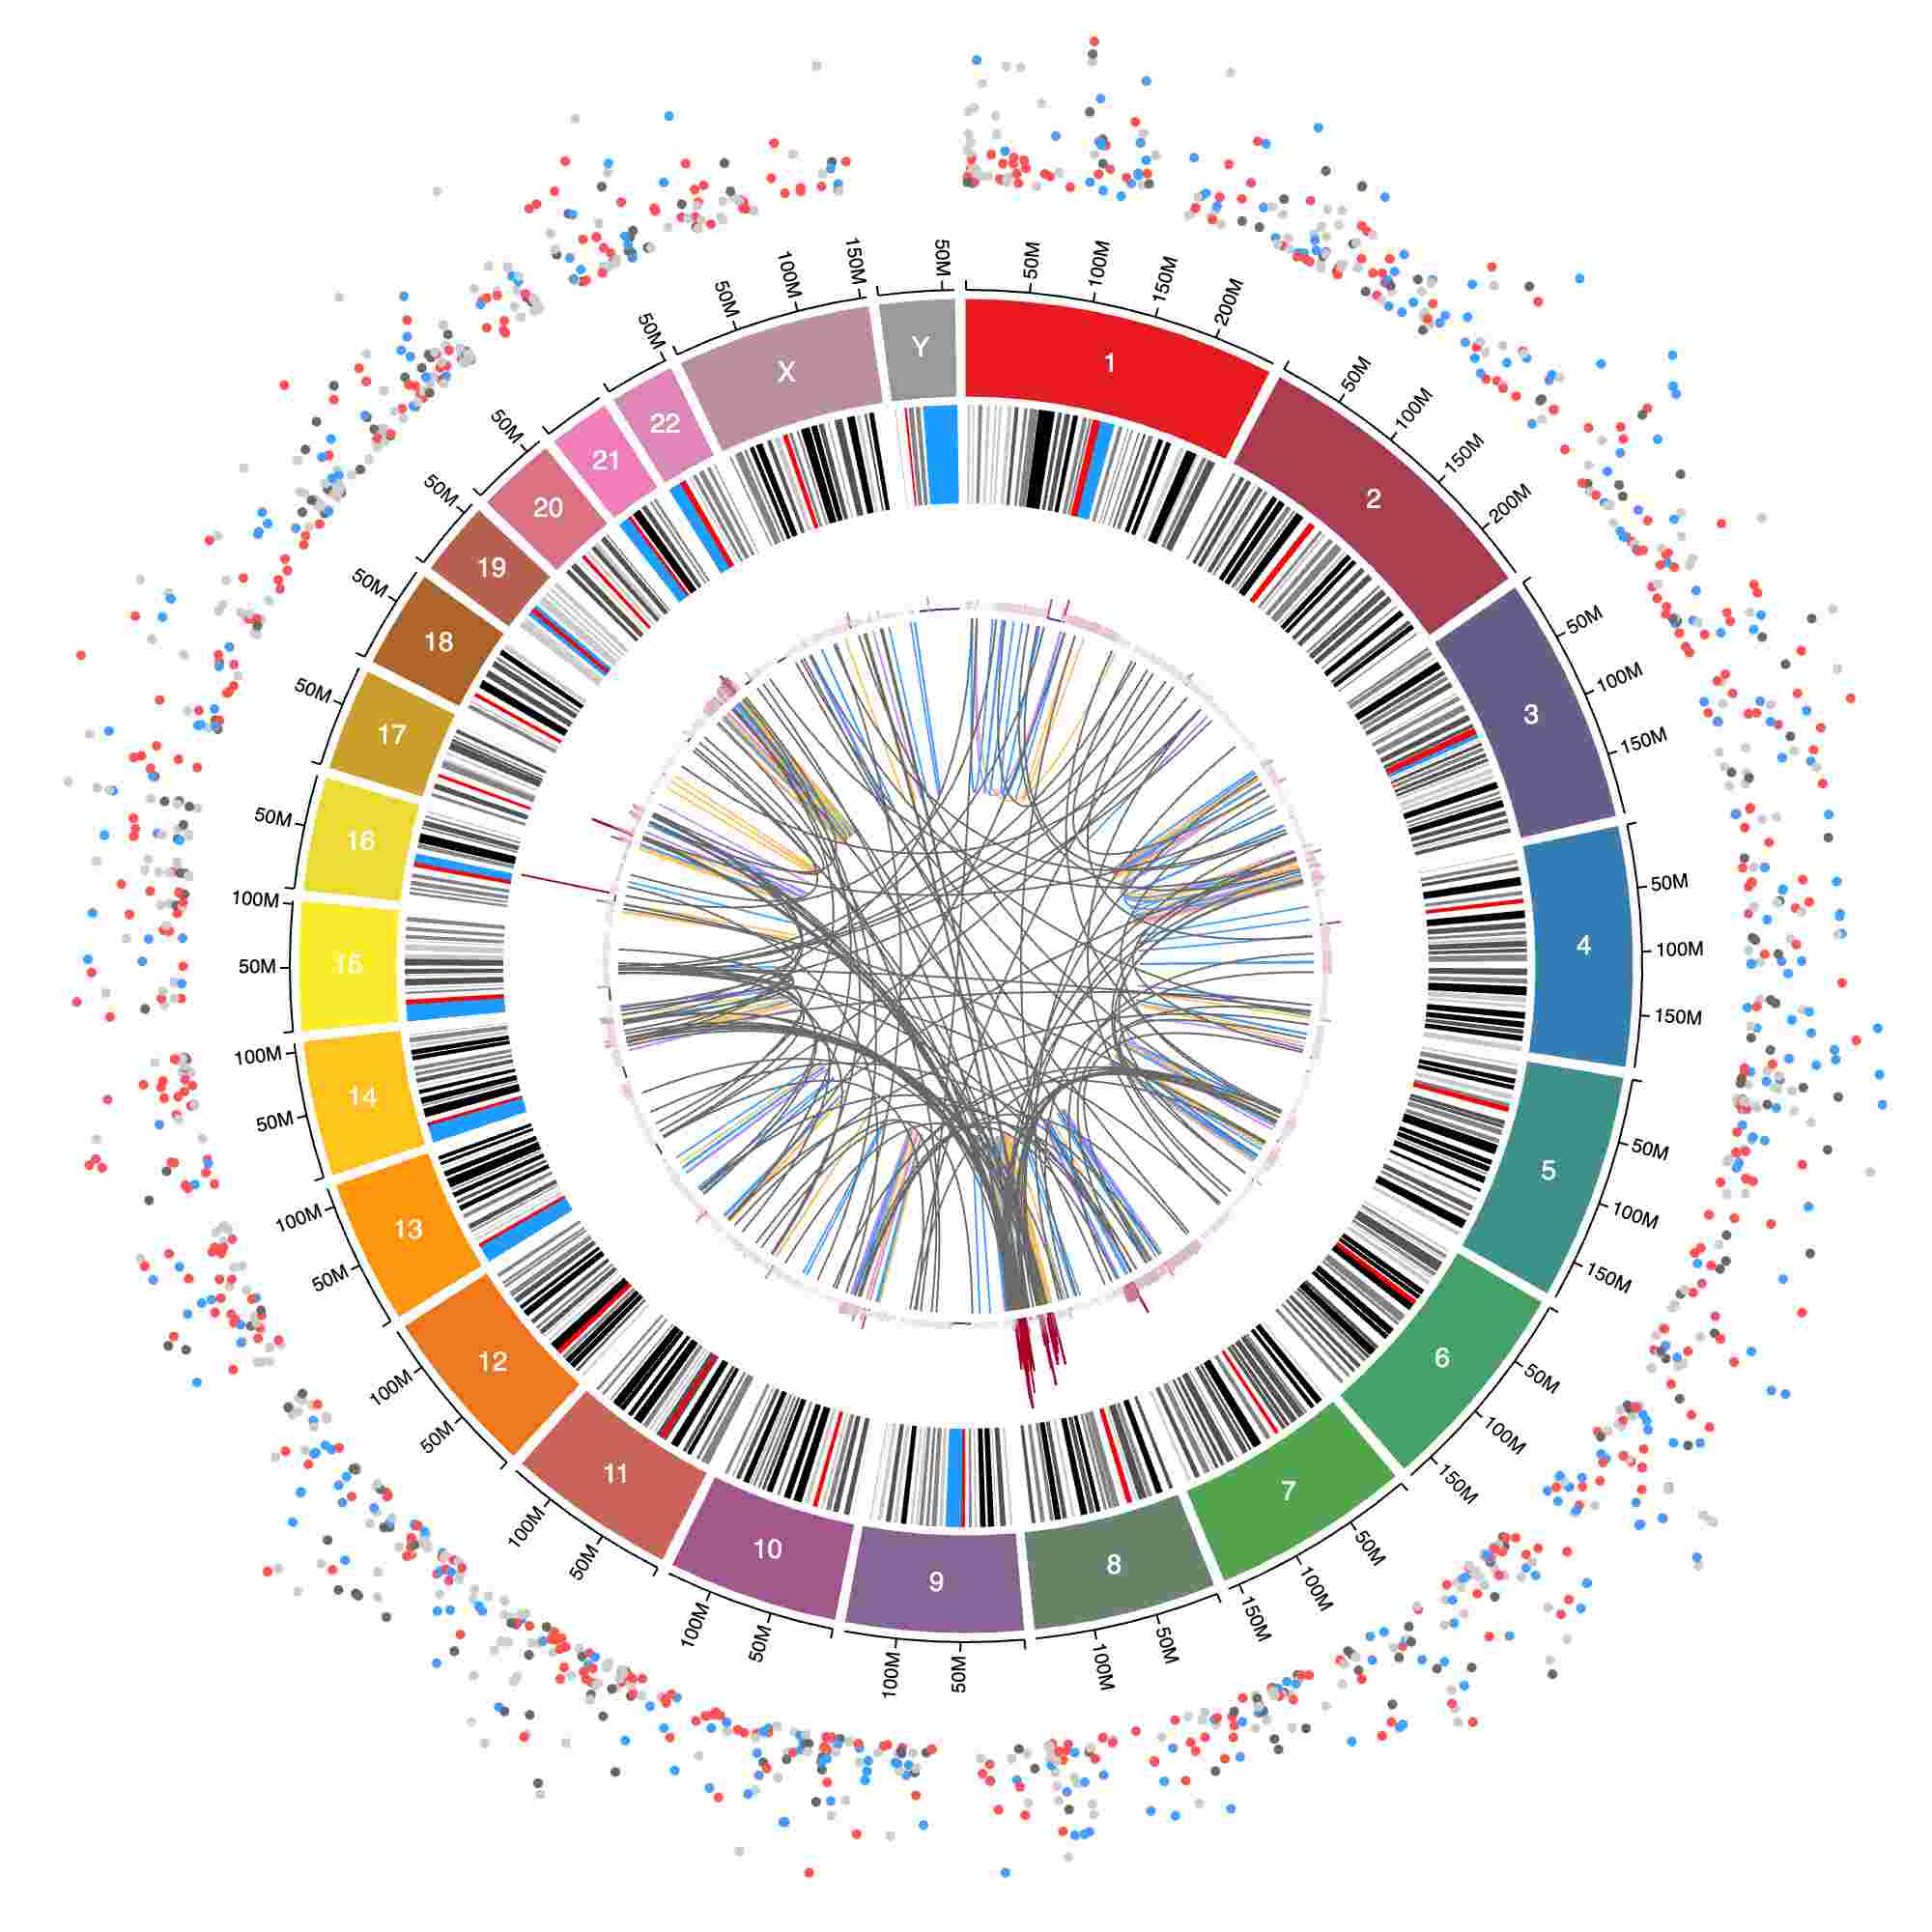
You can now explicitly set the min and max for the y-axis scale for all tracks with a "y" role, i.e. scatter, line, area, bars, and CNV.
By default, min and max for the y-axis scale is set from the data's actual min and max values. That default behavior is still the same, but now you can choose to override those values.
Added a new gallery example showing genome-to-genome alignments and how to achieve a perfect mirrored view in Circa:
You can now customize how chromosome names are displayed using the "pretty_name" field in Setup. See documentation for more details.
Automatically deduplicate chromosomes during Setup by keeping only the copy of each chromosome with the largest "size". This can be useful if you don't already have a list of how long your chromosomes (or other sequences) are but do have some data like coverage with bins that end where the chromosomes end. Just load that data in the Setup CSV/TSV file section and choose the bin end coordinates as size like below:
You can now delete all tracks associated with a data file.
Add pin style for the 'text' track type to allow showing text without overlapping.
Chromosomes can now be flipped to enable better comparisons between two genomes/haplotypes. Read more here.
All colors now have copy-pastable hex codes:
The gallery also features a new plot of RNA-seq differential expression:
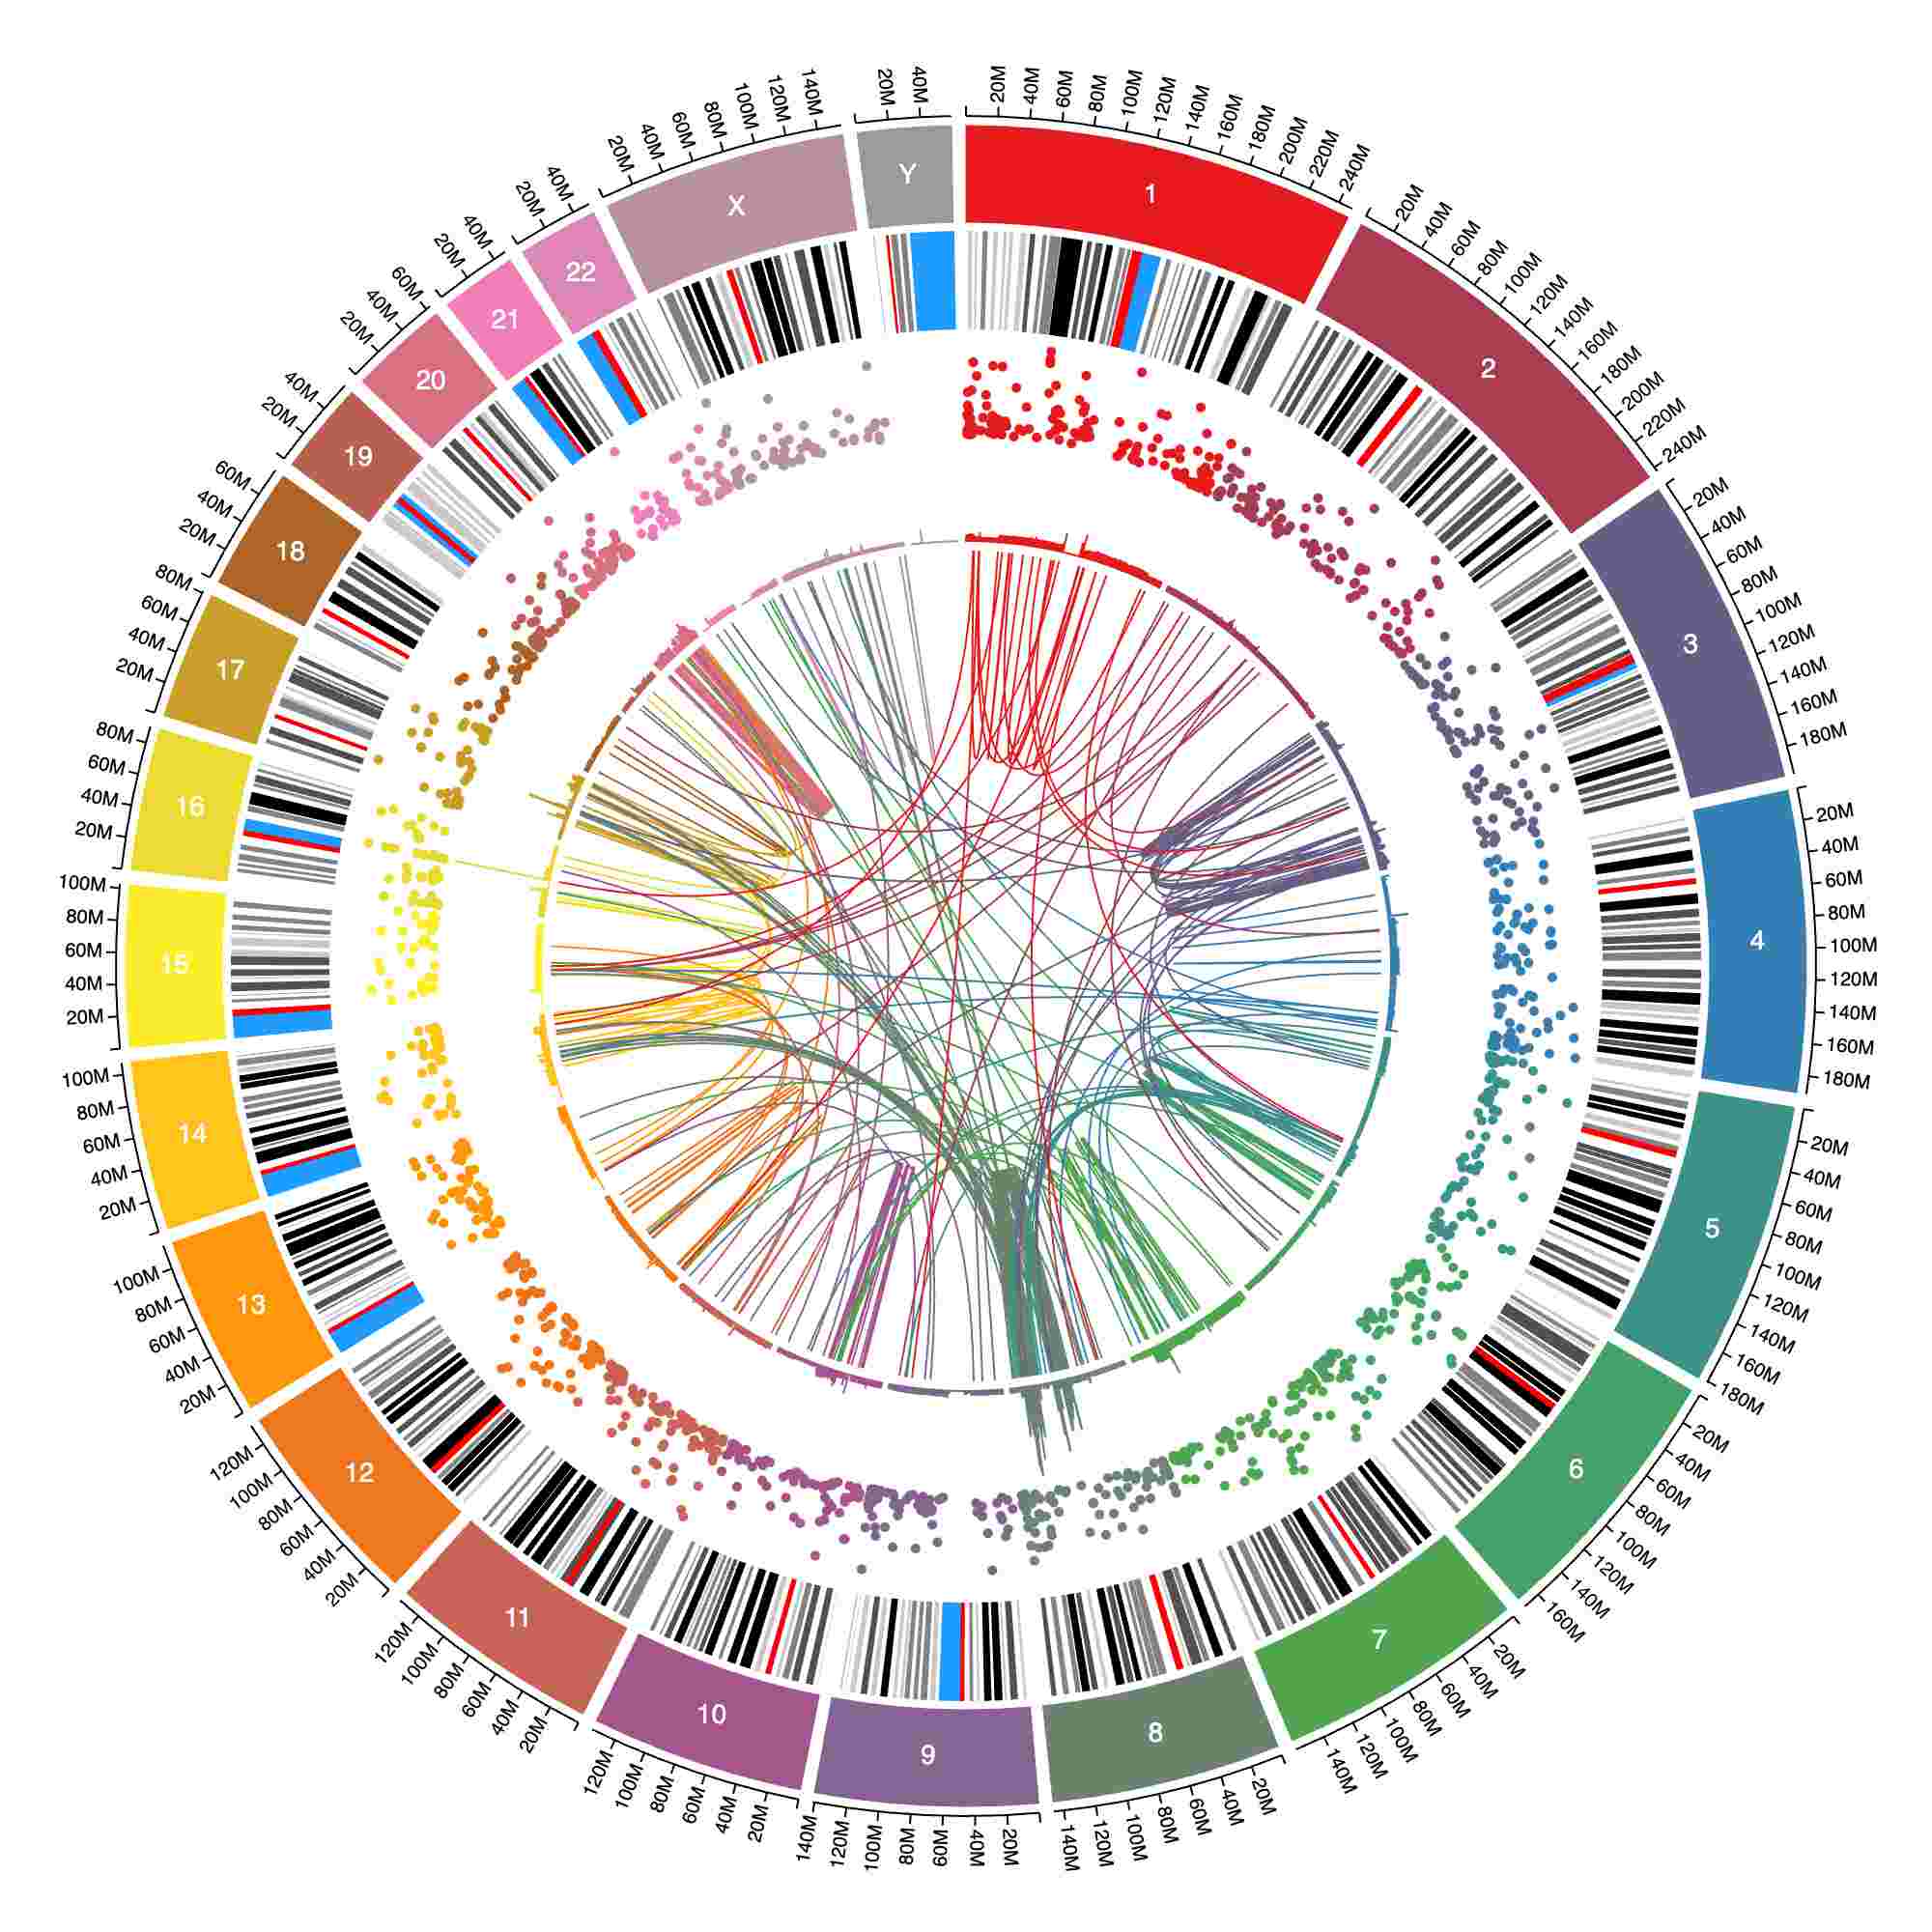
Coloring tracks by structural variant type
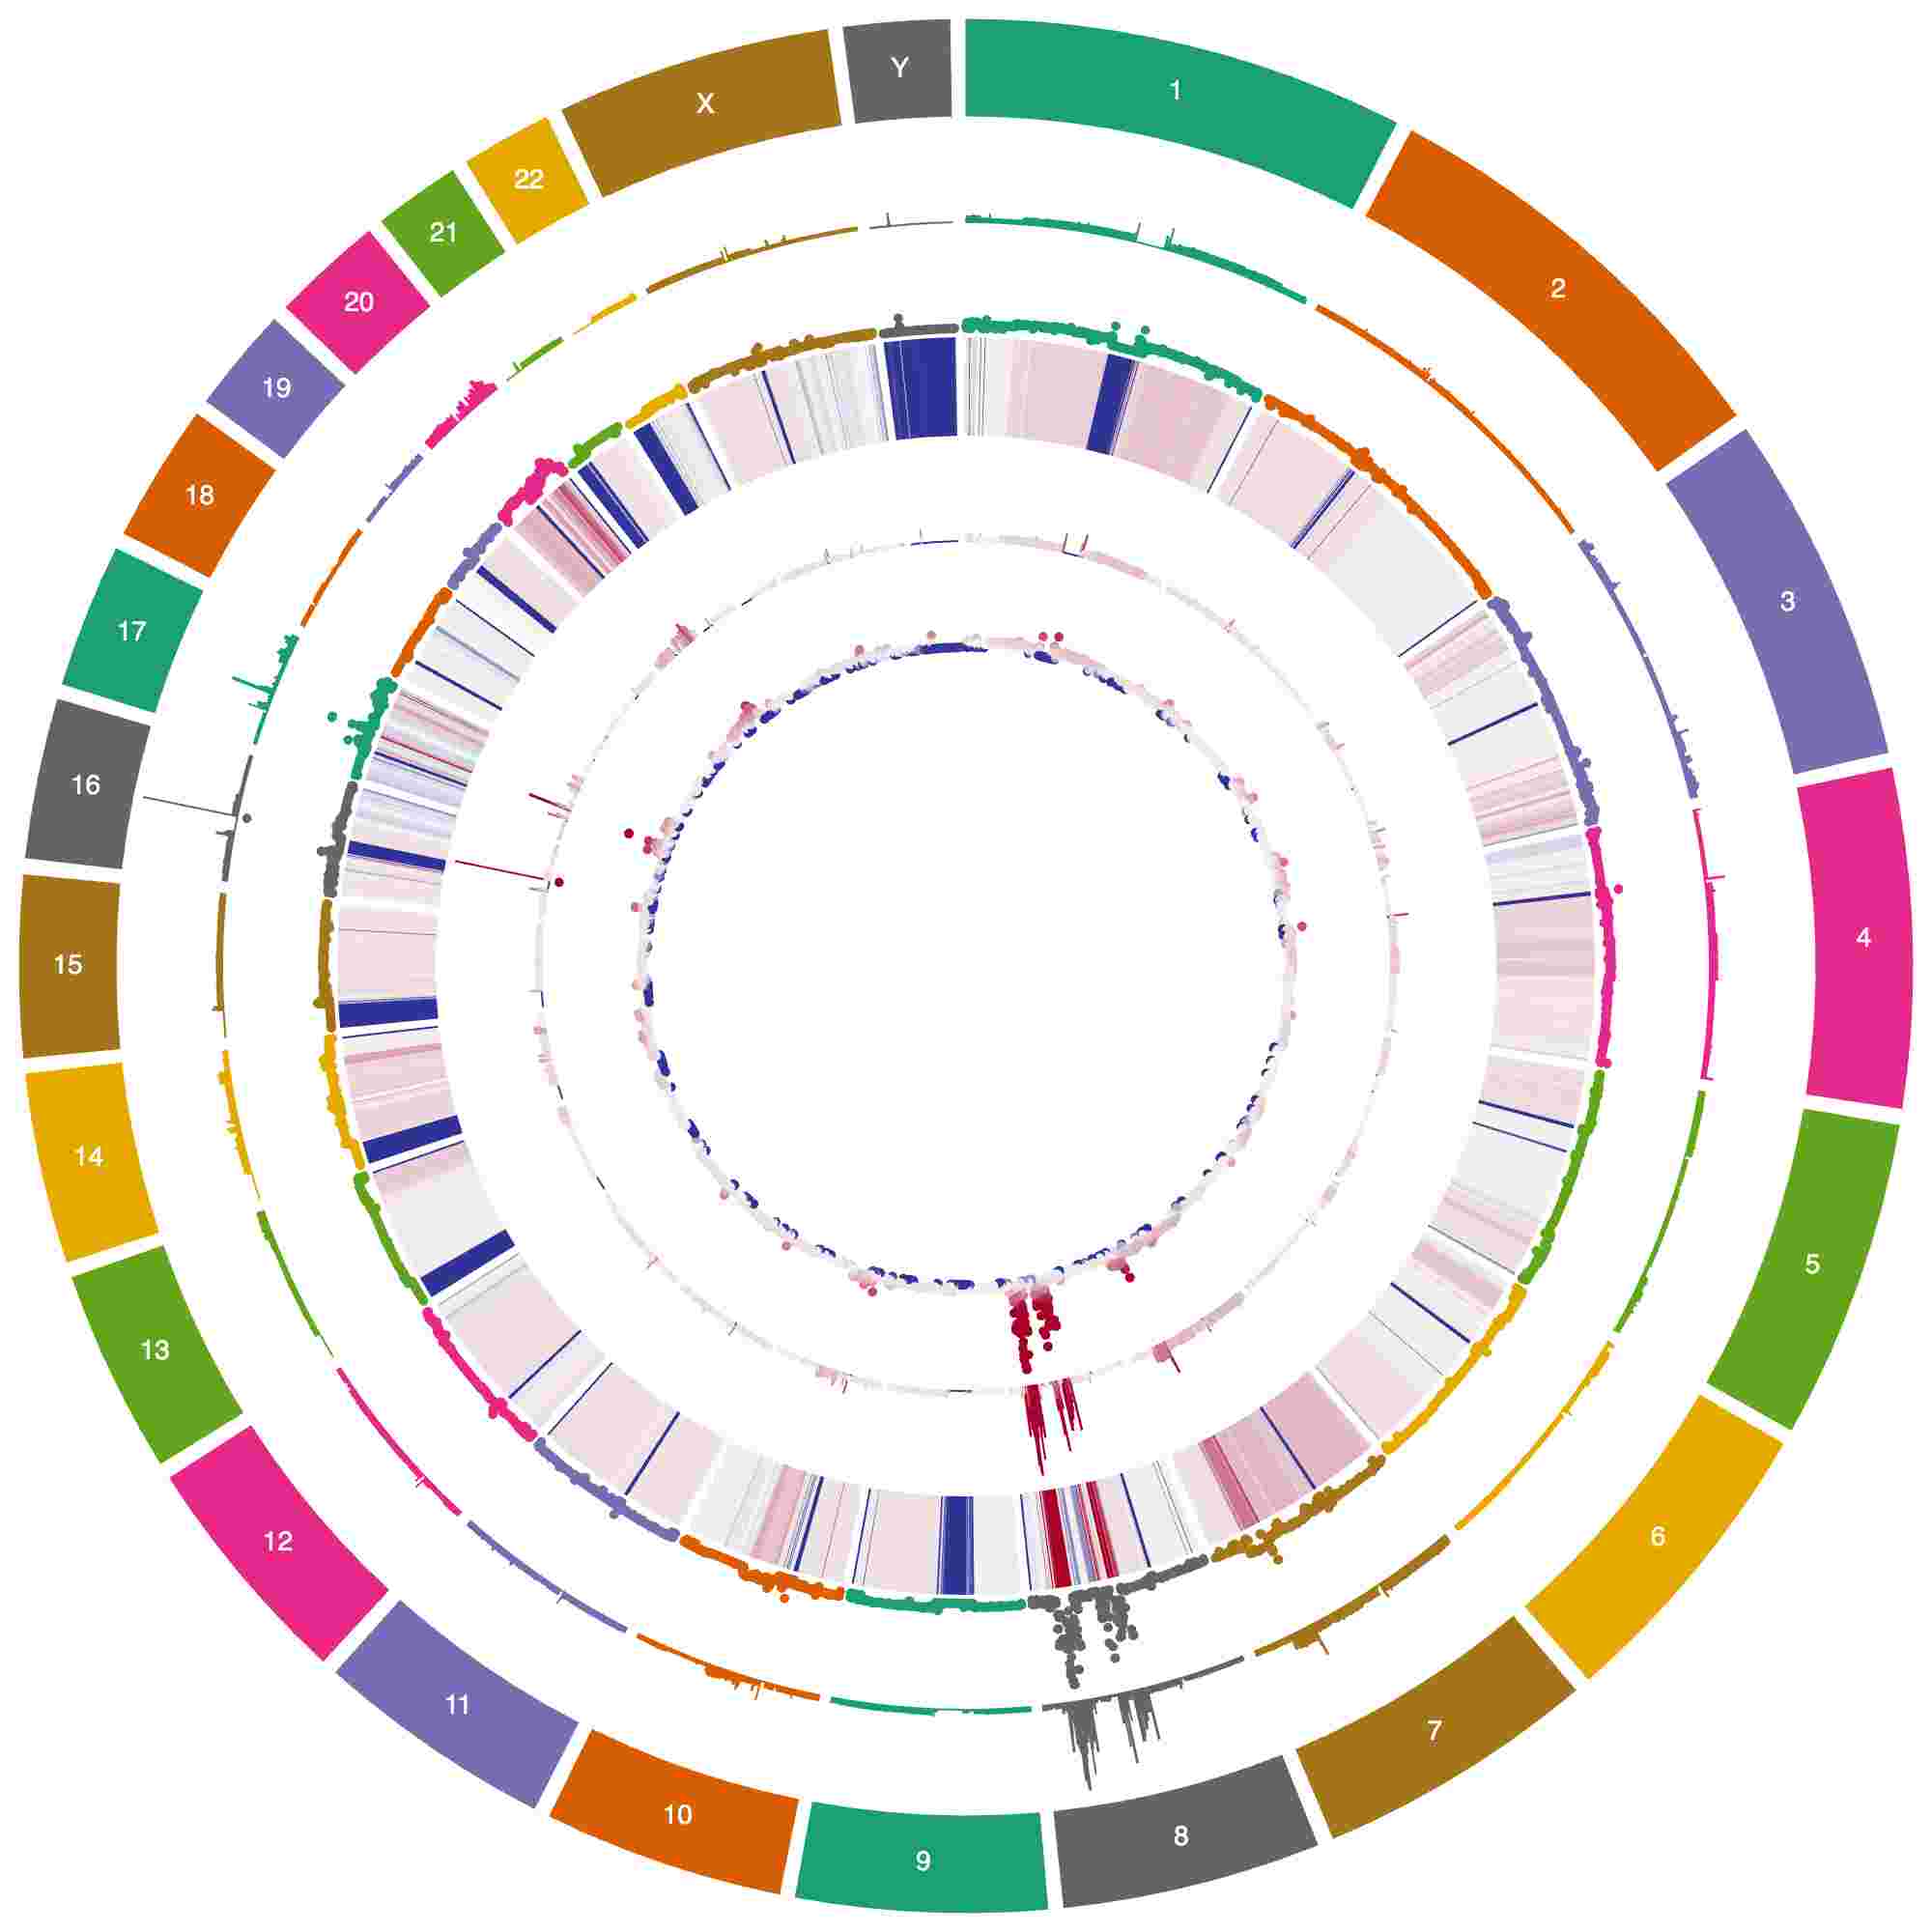
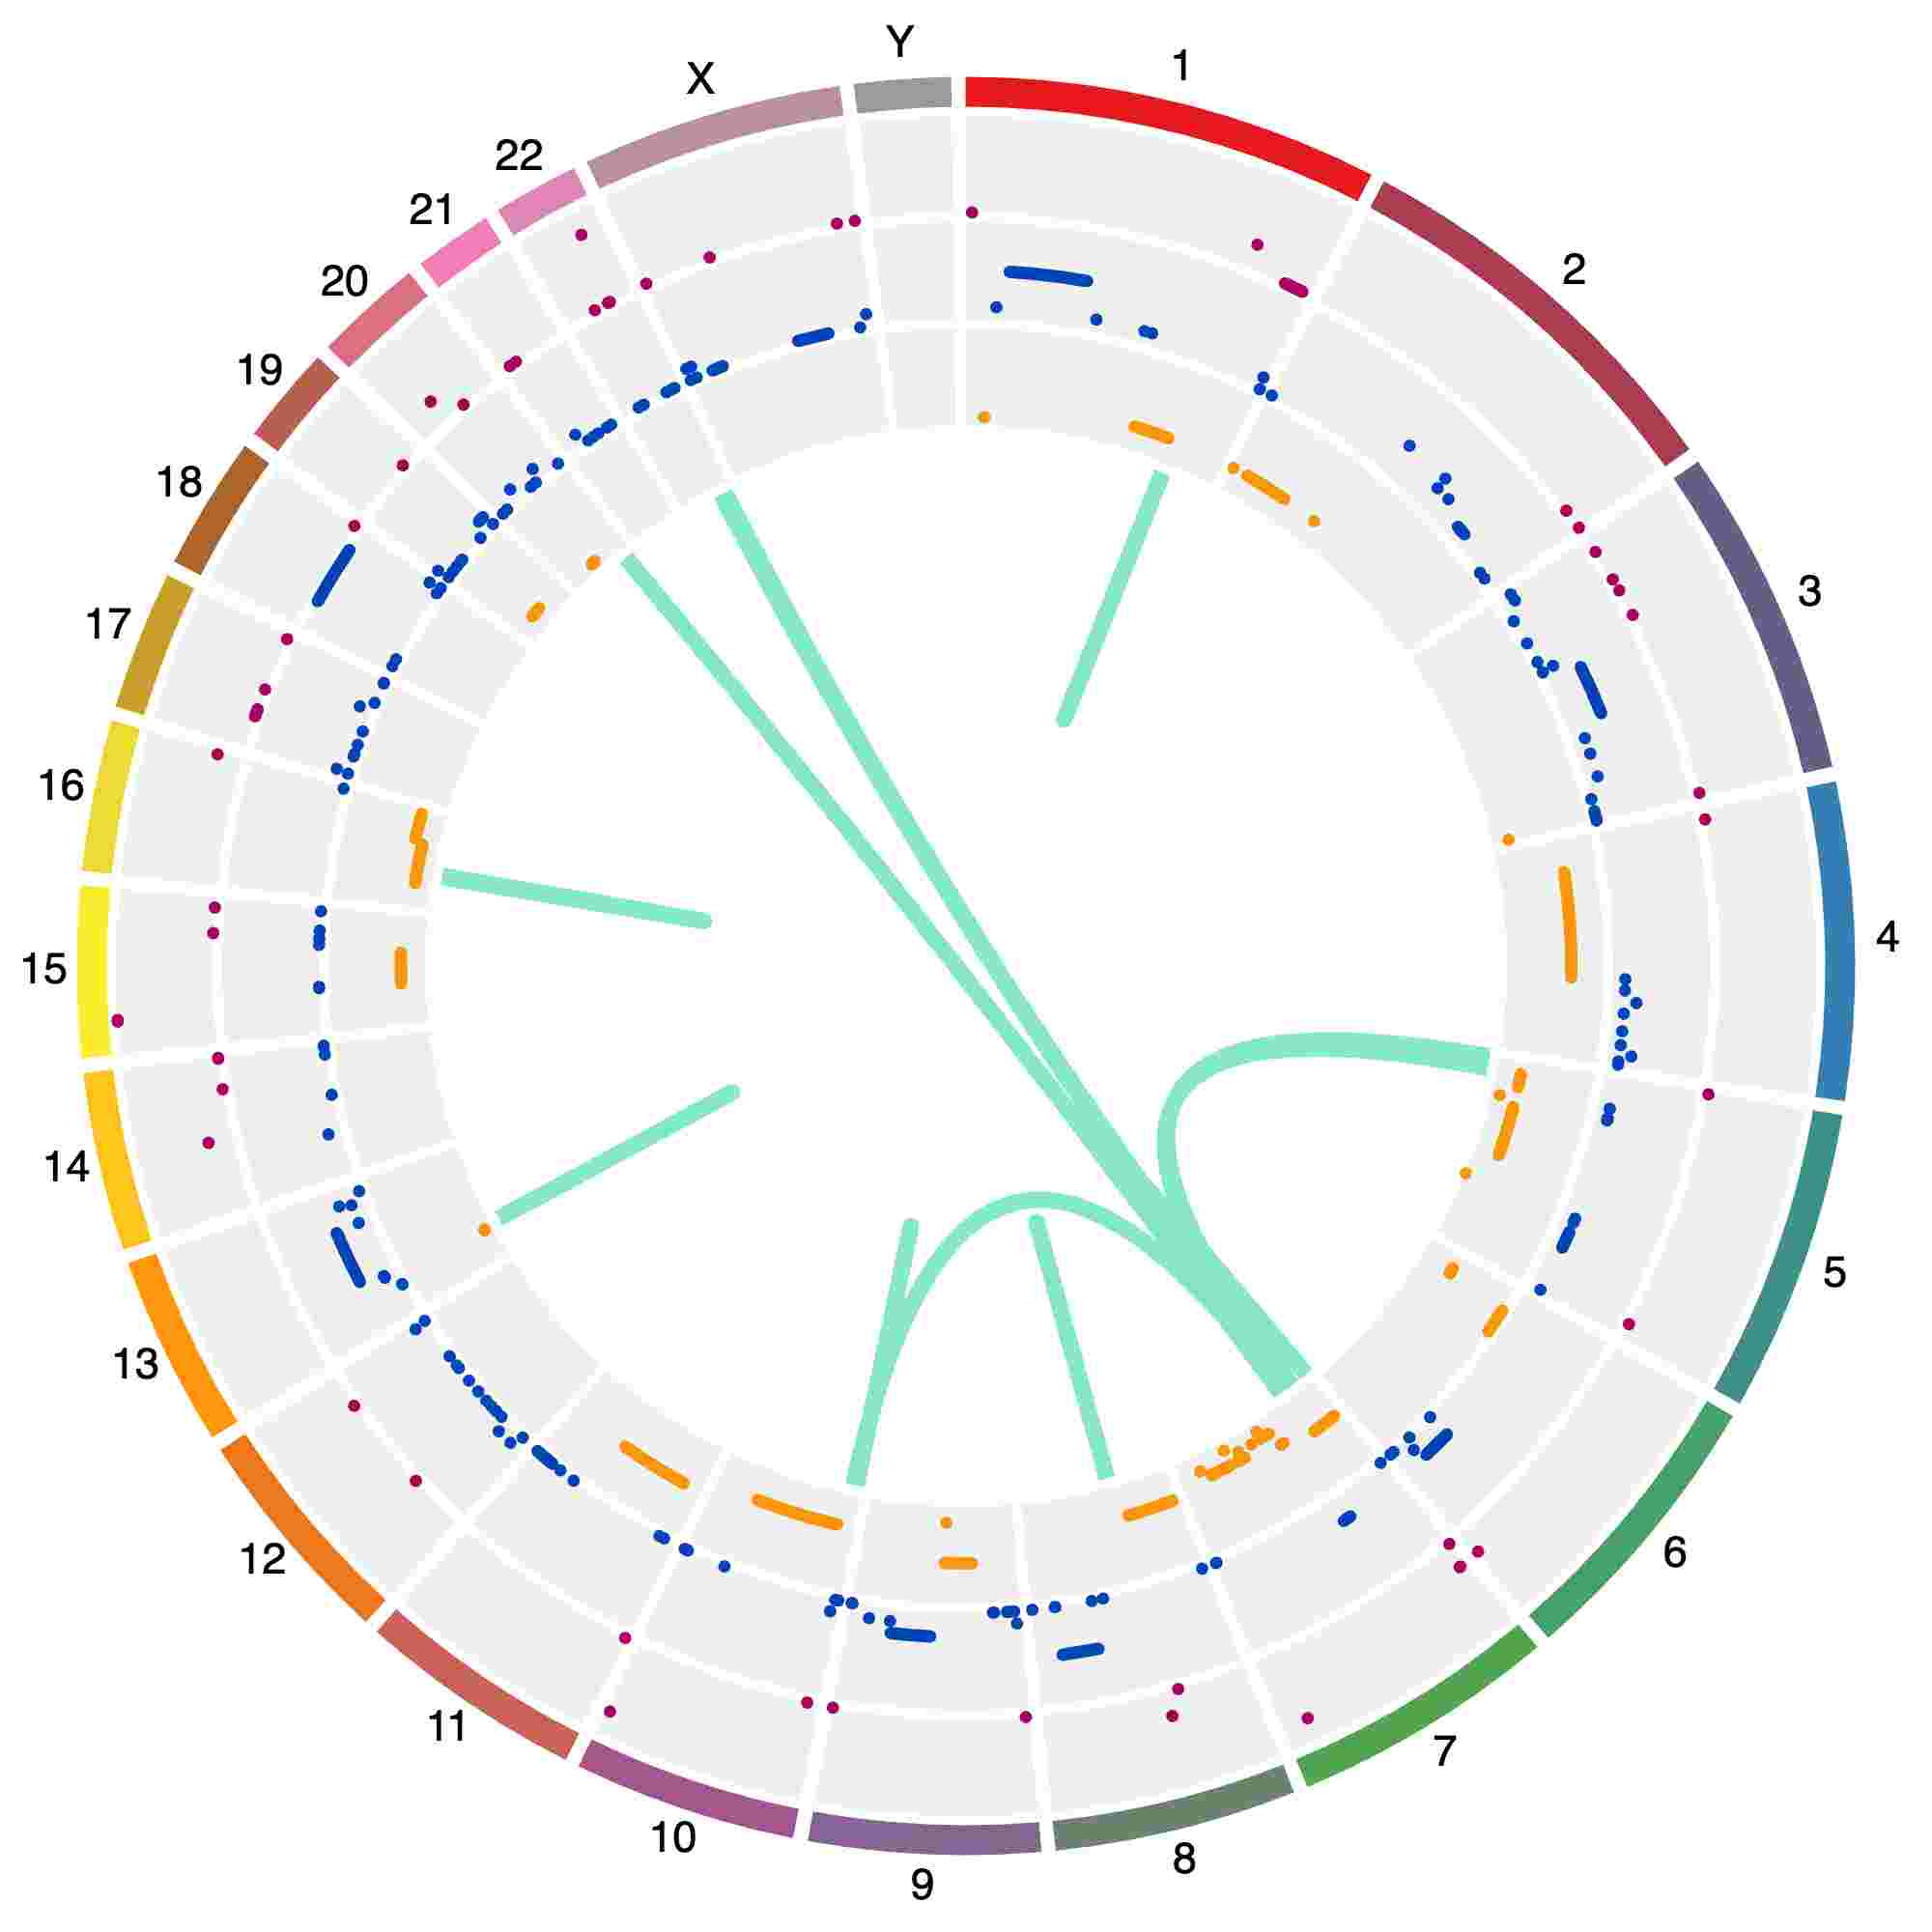
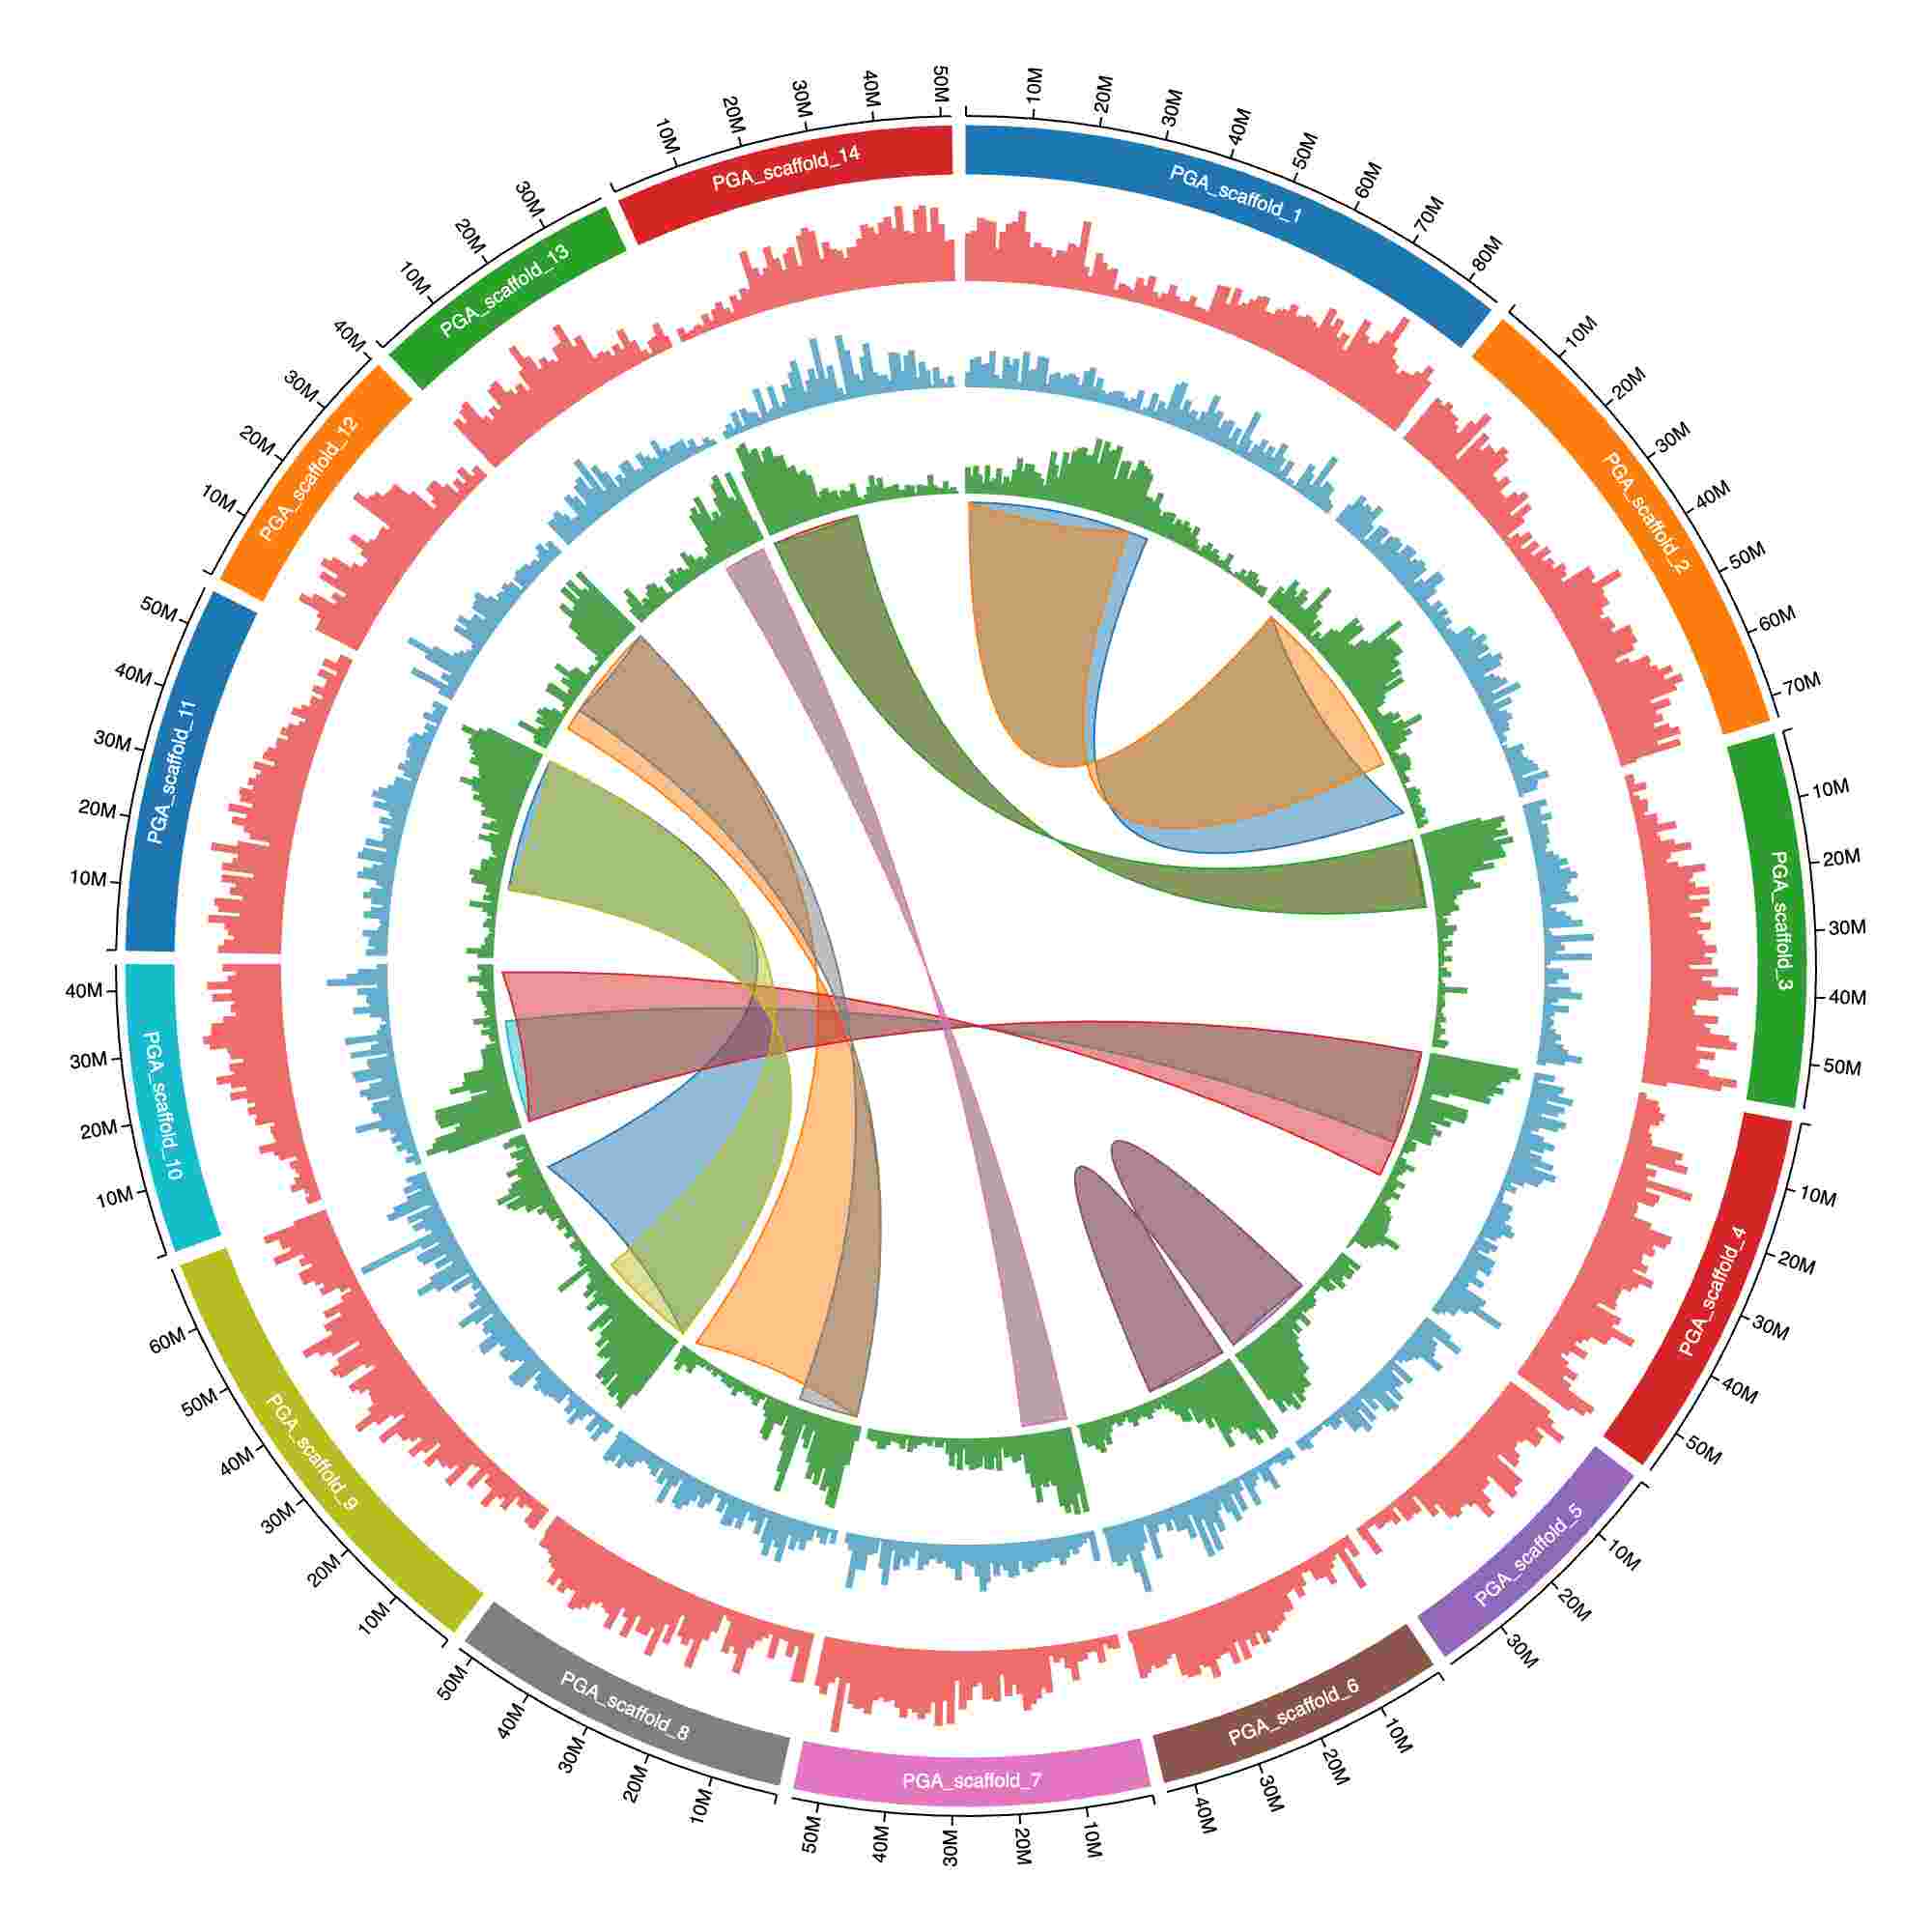
Many ways to show copy number data in Circa
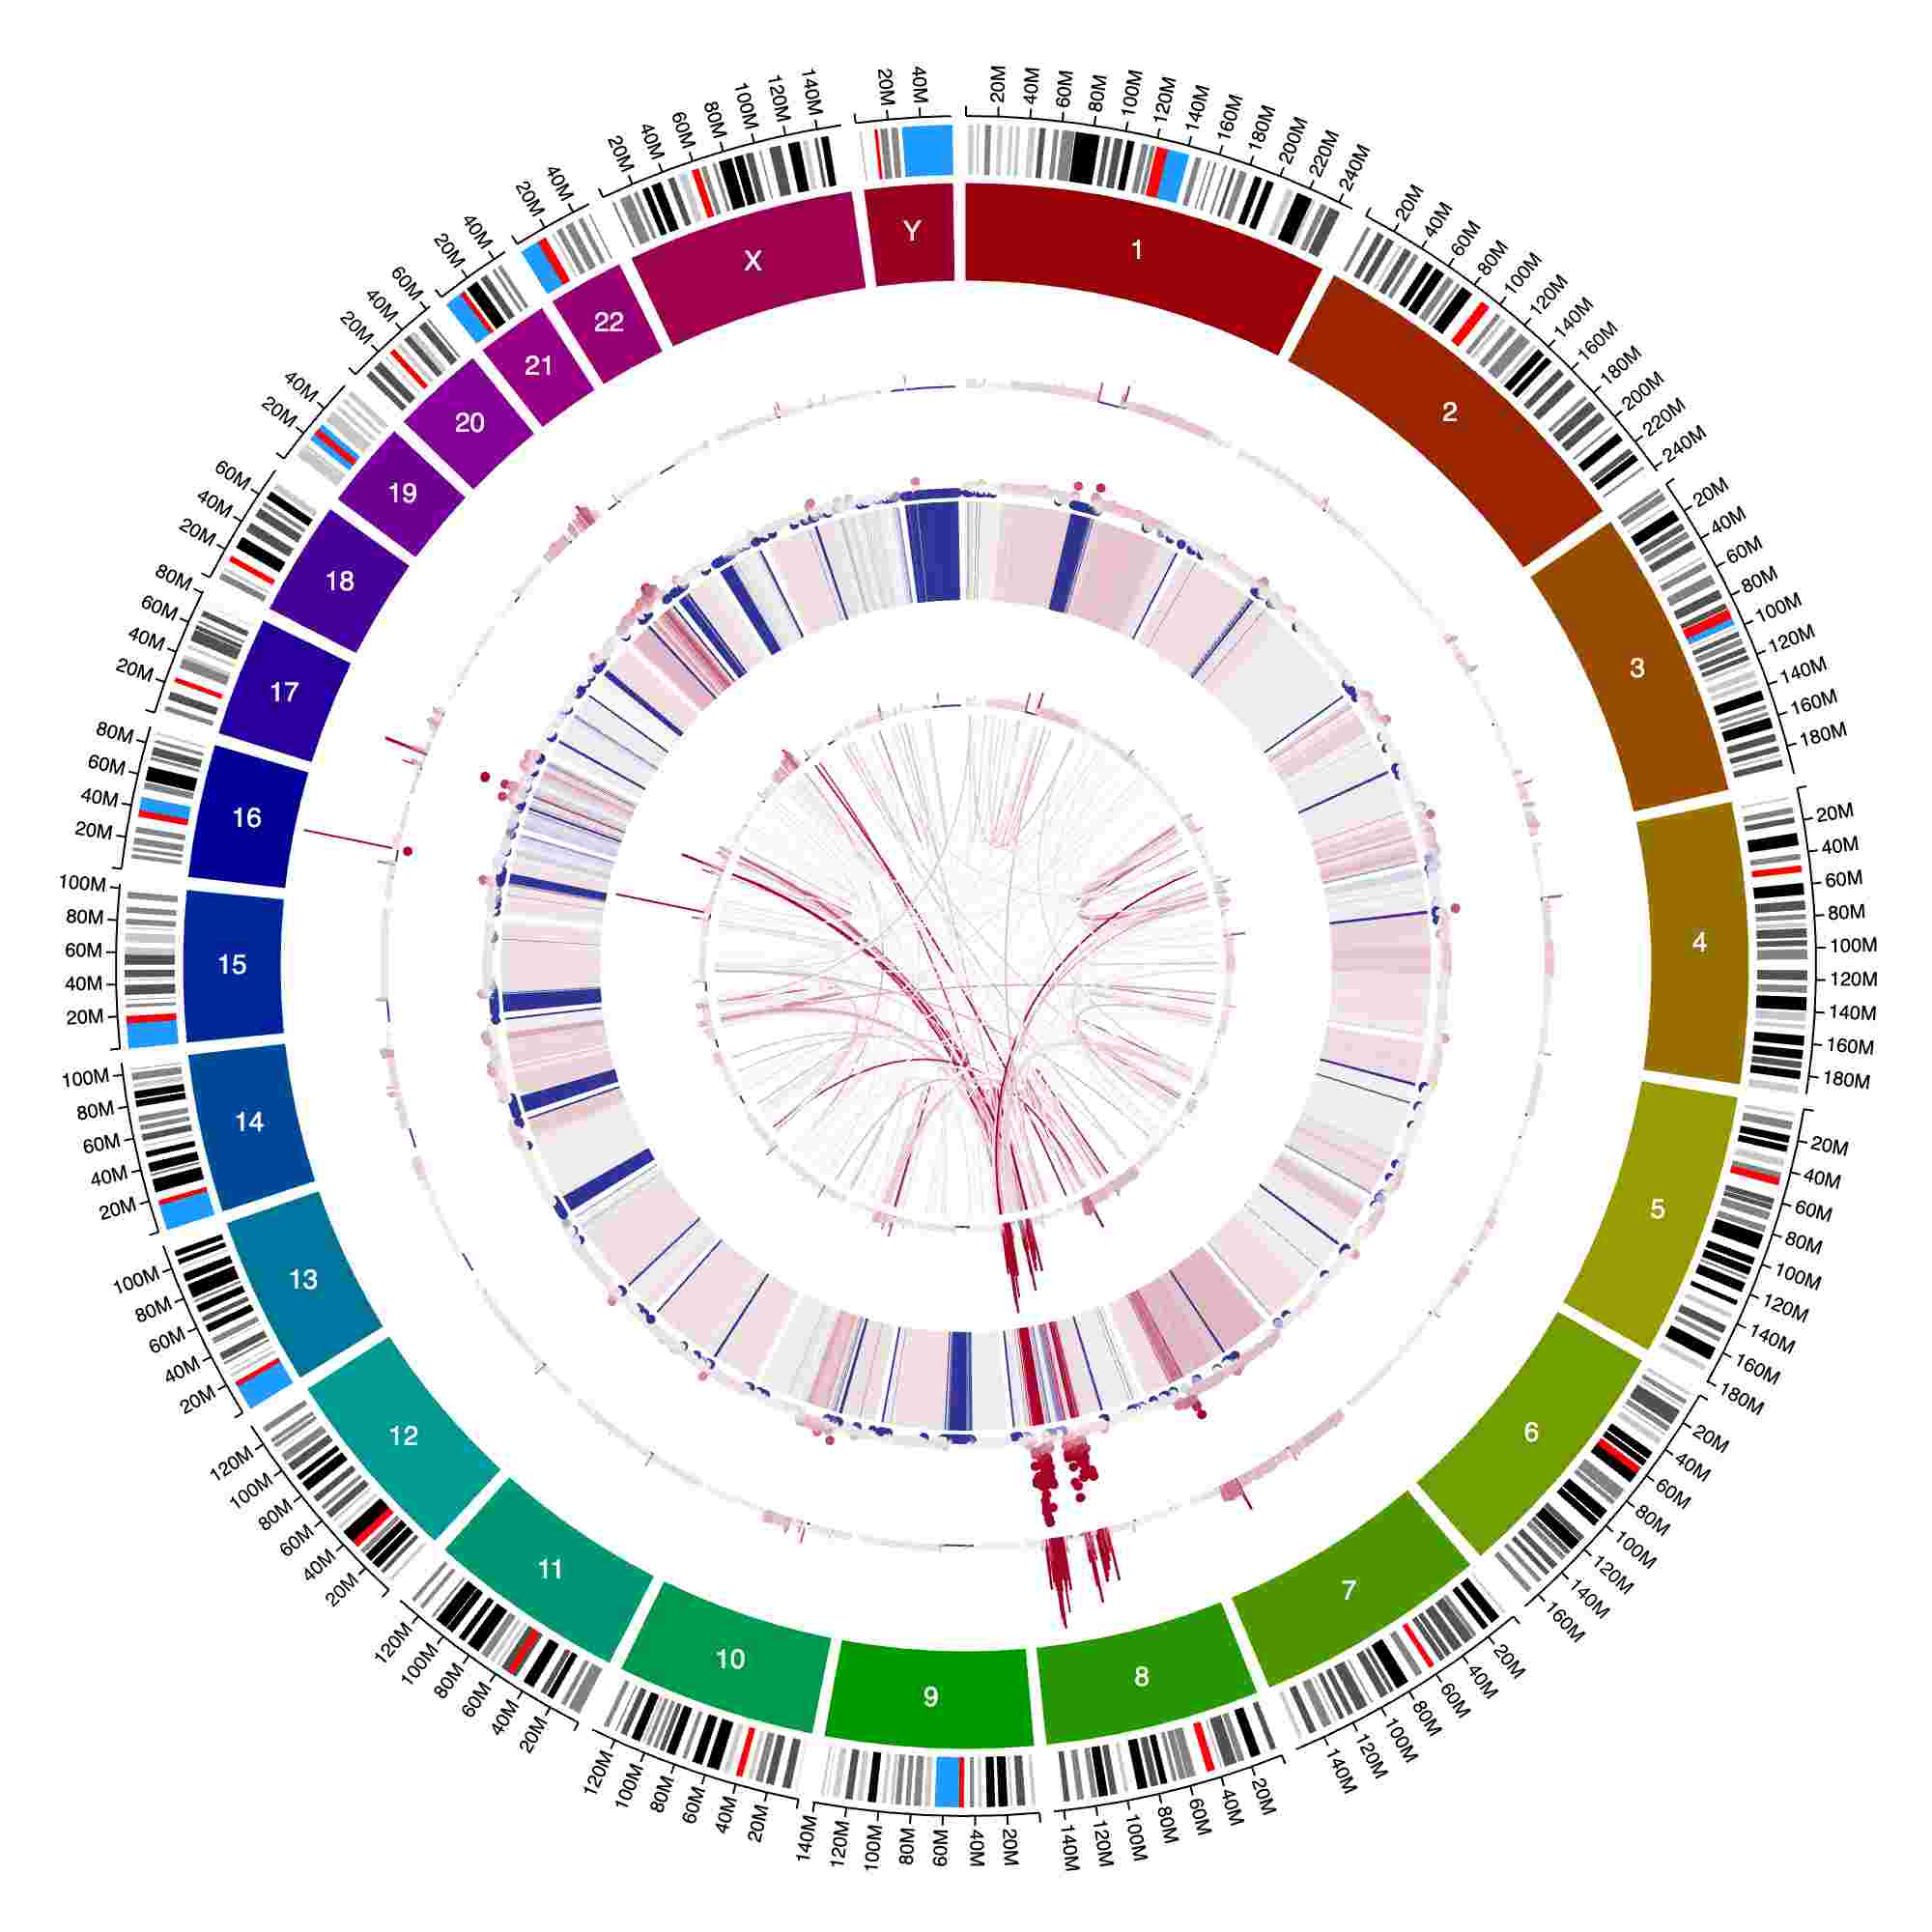
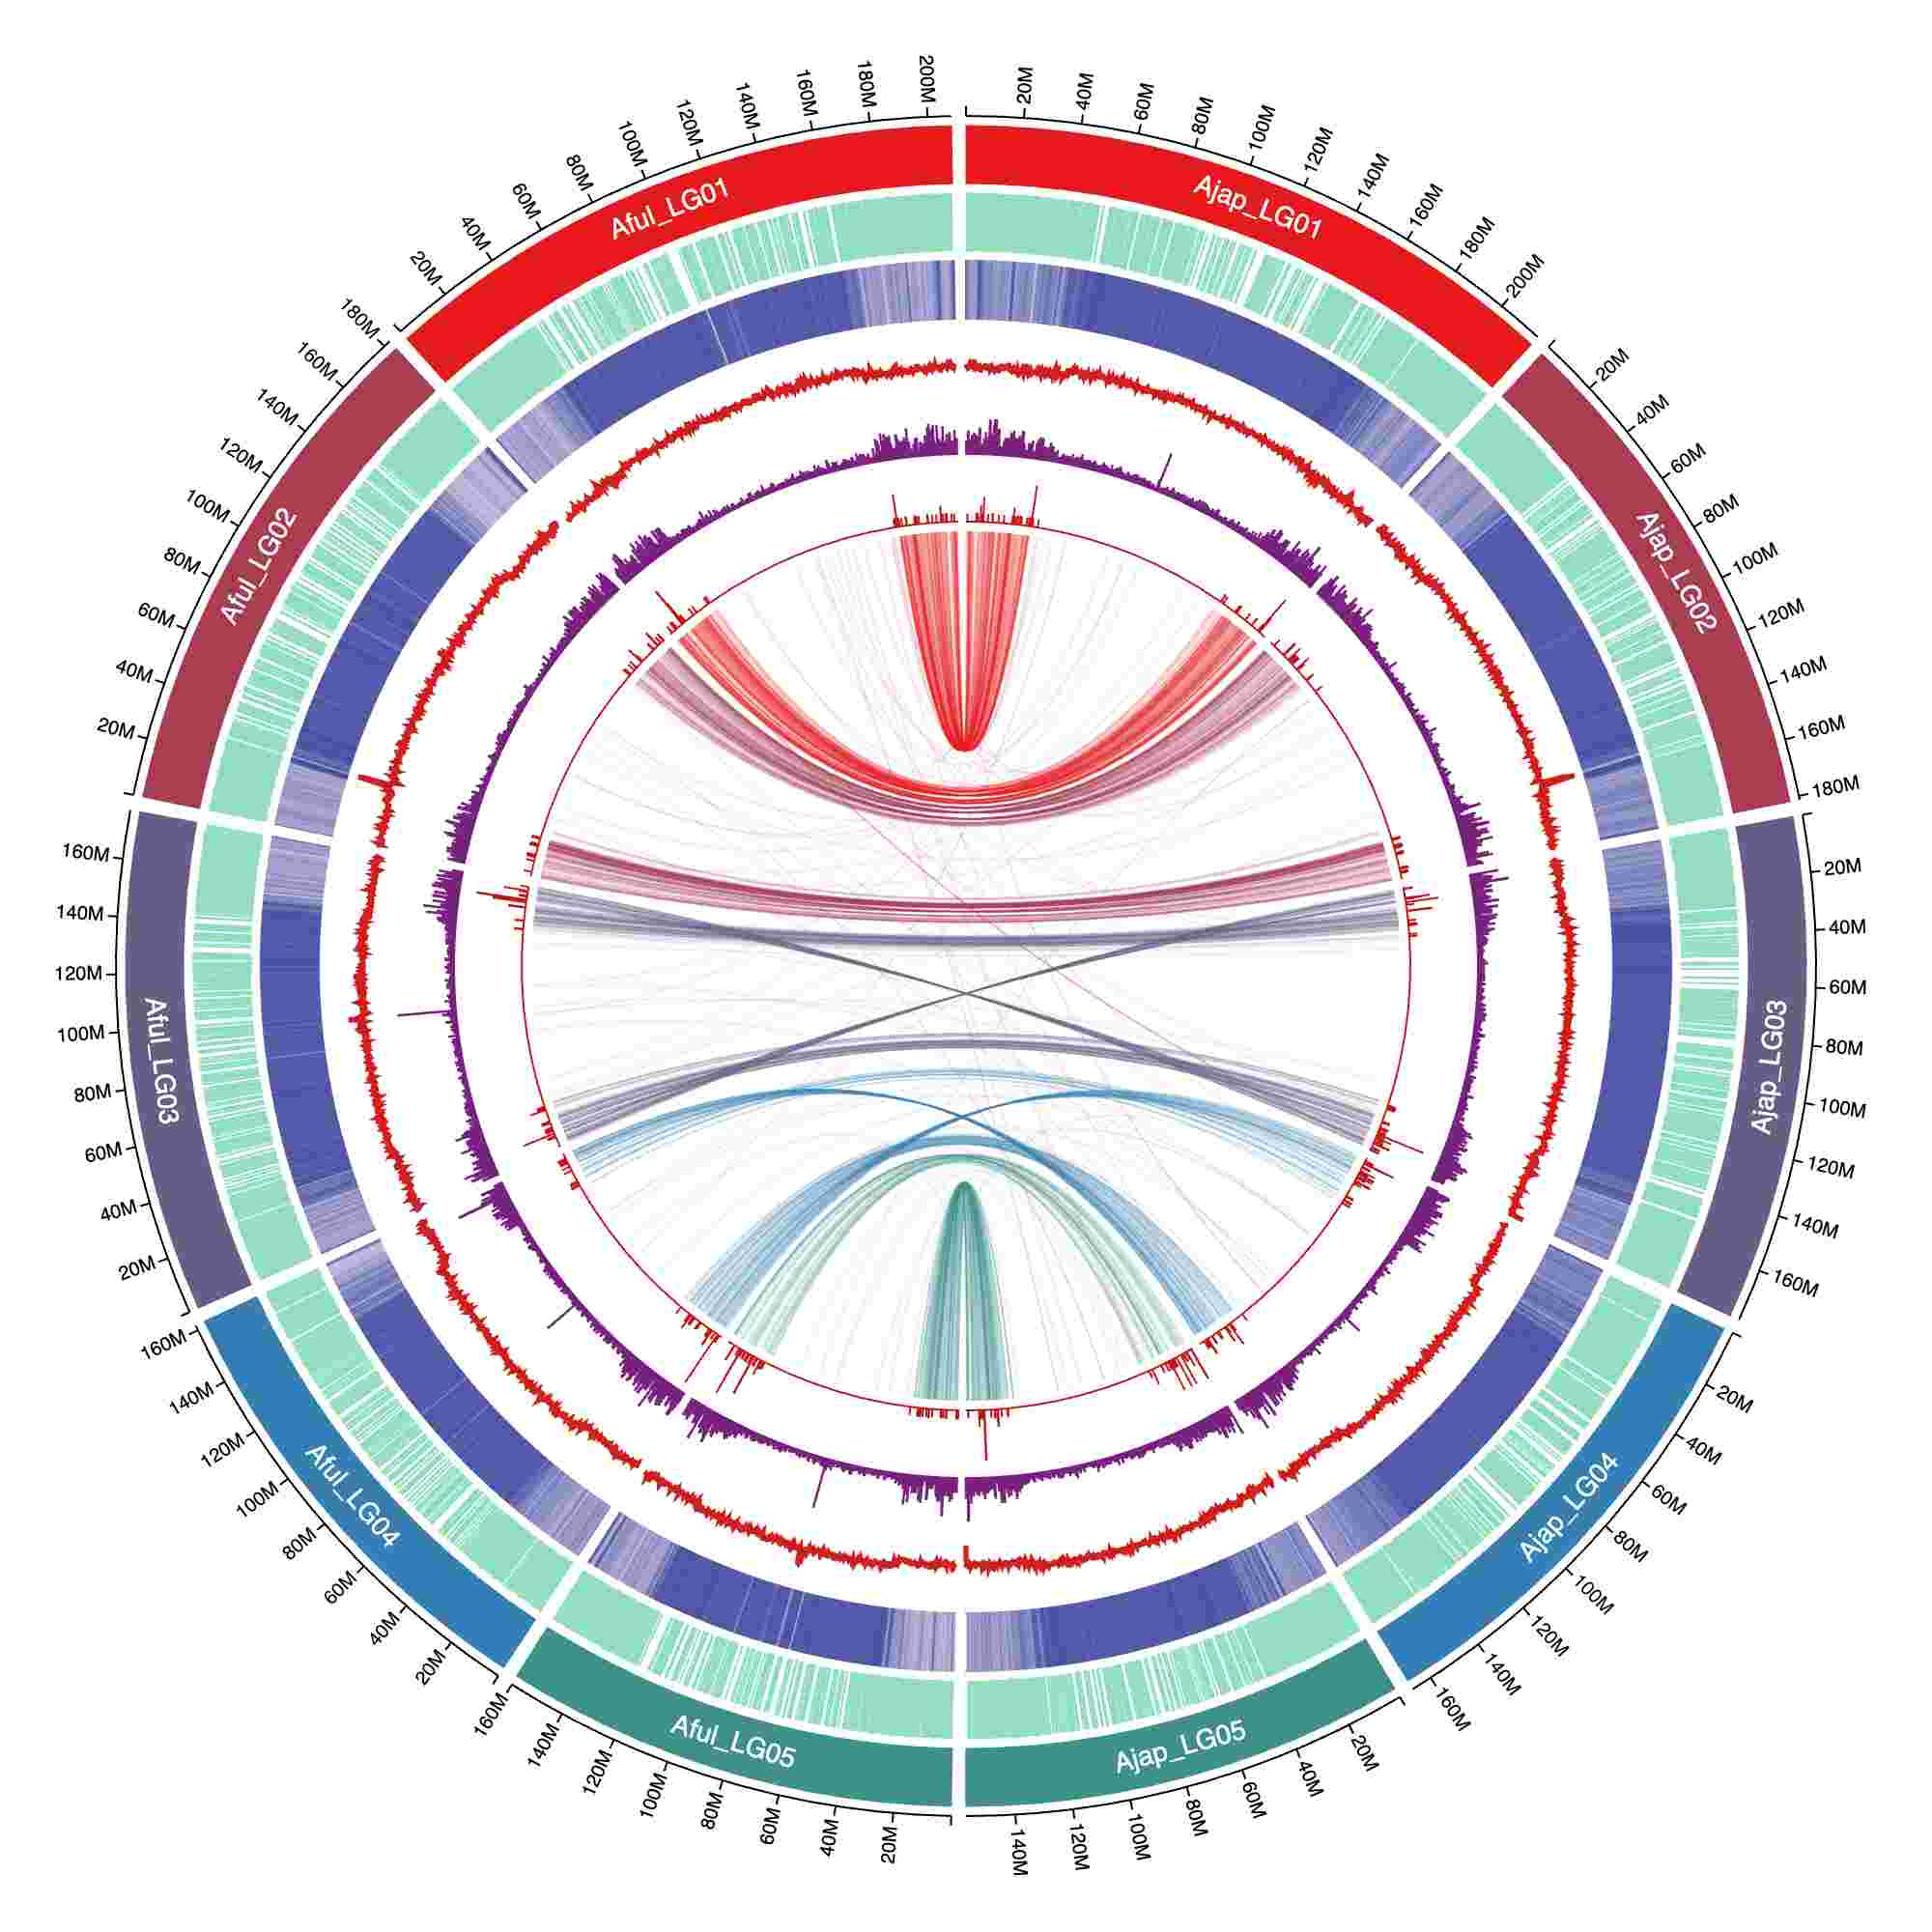
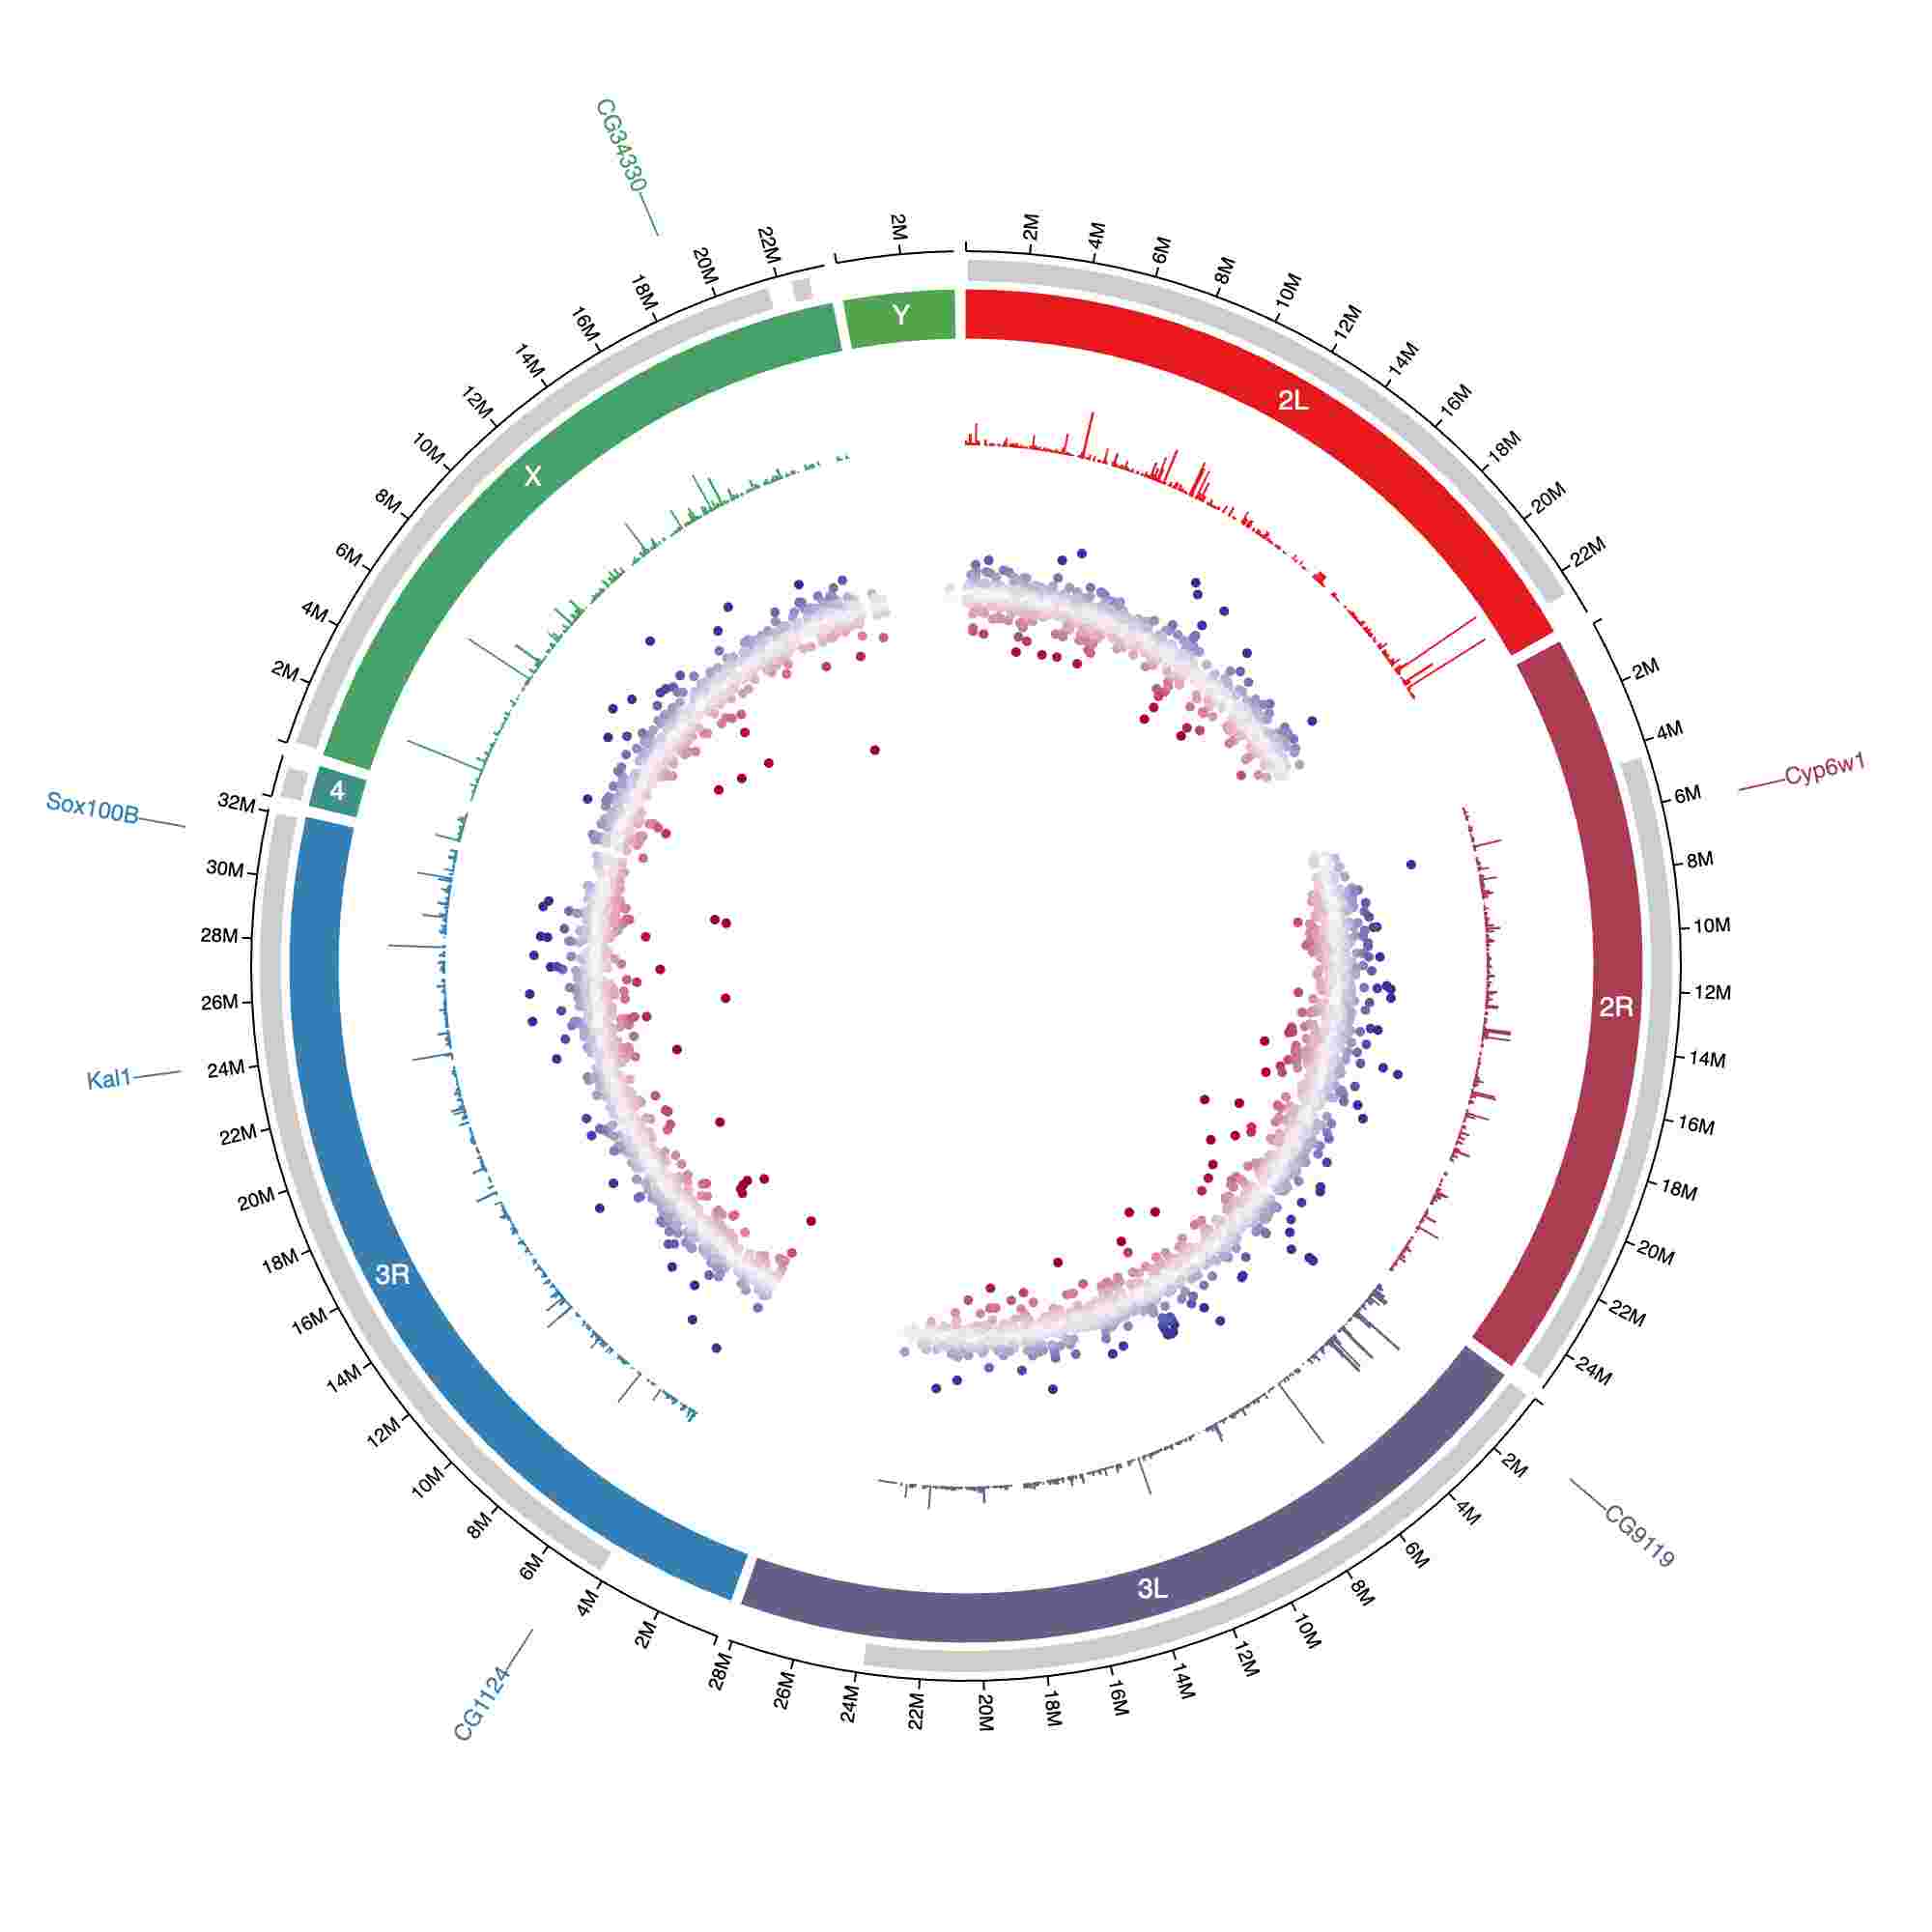
Several track types with continuous color scales